Aligning Multiple Series with Categorical Values
Binding Categorical Data Overview
Binding chart to the data source with categorical values is pretty simple and usually requires just one line of code:
| Chart1.Series["Series1"].Points.DataBind(mySource, "ProductName", "Sales"); |
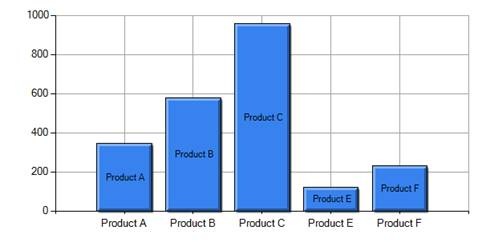
It is important to understand that after DataBind method creates series DataPoint objects, their XValue property will always be set to zero and category is saved in the AxisLabel property. Position of each data point along the category axis is determined using the index of the object in Series.Points collection. Below is an example of what your chart may look like:
Alignment of Multiple Series
When you bind multiple series with categorical values you may run into some un-expected results based on how you prepare your data source. For example, let's imagine that our two chart series are bound to this data:
| Series 1 | Series 2 |
| Product A = 320 | Product B = 420 |
| Product B = 580 | Product E = 830 |
| Product C = 980 | |
| Product E = 100 | |
| Product F = 220 |
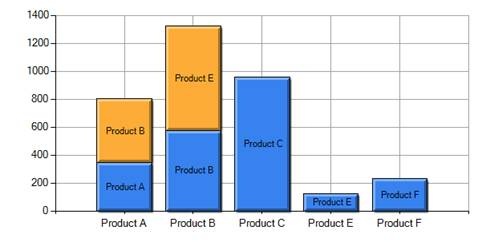
As you can notice, we have less categories for the second series and their order does not match categories from the first series. If we try binding chart to this data we will end up with the chart shown below. Chart uses index of the data point to position them along the axis and we end up with orange series points in the wrong position. I added data point labels so that it would easier to see the issue.
In order to resolve this we can modify our data source to contain same number of categories in the same order like this:
| Series 1 | Series 2 |
| Product A = 320 | Product A = Null |
| Product B = 580 | Product B = 420 |
| Product C = 980 | Product C = Null |
| Product E = 100 | Product E = 830 |
| Product F = 220 | Product F = Null |
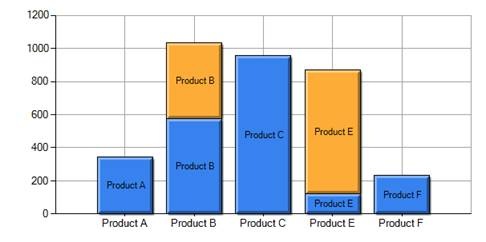
Simpler approach is just to make a single call to Chart.AlignDataPointsByAxisLabel method which will automatically align the two series by inserting empty points and the end result will look like this:
Hope this helps!
Alex.