
Improved exception reporting for C++ Windows Store Apps in Visual Studio 2013
Windows 8.1 and Visual Studio 2013 come with improvements for exception reporting in the platform and the debugger which will make it easier for native Windows Store App developers to diagnose errors in their applications. In this post, I’ll discuss a few of those improvements that are available in Visual Studio 2013 and show the differences in the debugging experience between Visual Studio 2012 and Visual Studio 2013.
The sample project that contains the code snippets in this post can be downloaded from here.
Captured Stacks for Windows Runtime Exceptions
Windows 8.1 adds support for capturing stack traces for exceptions as they are reported in Windows Runtime components. The debugger in Visual Studio 2013 can display those captured stack traces whenever they are available on exception objects that are derived from Platform::Exception.
To see this in action, start debugging the sample application in this post in Visual Studio 2013, put a breakpoint in the catch block below and then click on ‘Throw Handled’ button in the main application page. It will execute the event handler code below which simply catches an exception that is thrown inside the ThrowDataReaderError method.
void ExceptionSample::MainPage::ThrowDataReaderError()
{
DataReader^ dataReader = ref new DataReader(nullptr);
dataReader->LoadAsync(100);
}
void ExceptionSample::MainPage::btnThrowHandled_Click_1(Platform::Object^ sender, Windows::UI::Xaml::RoutedEventArgs^ e)
{
try
{
ThrowDataReaderError();
}
catch (Platform::Exception^ e)
{
OutputTextBlock->Text = e->Message;
}
}
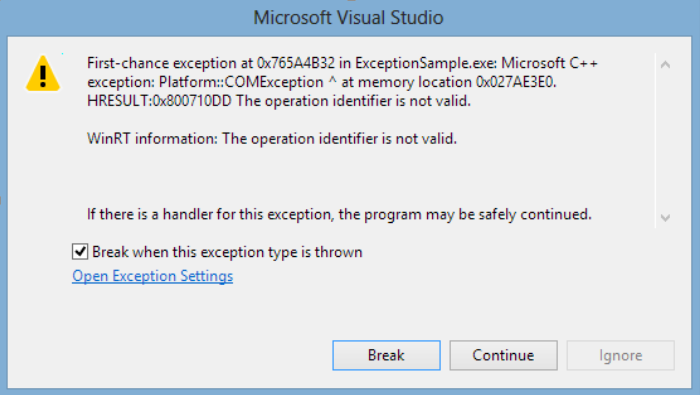
The COM exception raised inside LoadAsync method causes the execution to break into the debugger with the exception dialog showing its details. The Visual Studio 2012 version of the dialog shows only the WinRT error information for this exception:
Visual Studio 2013 version of the dialog displays the additional stack trace information for the same exception:
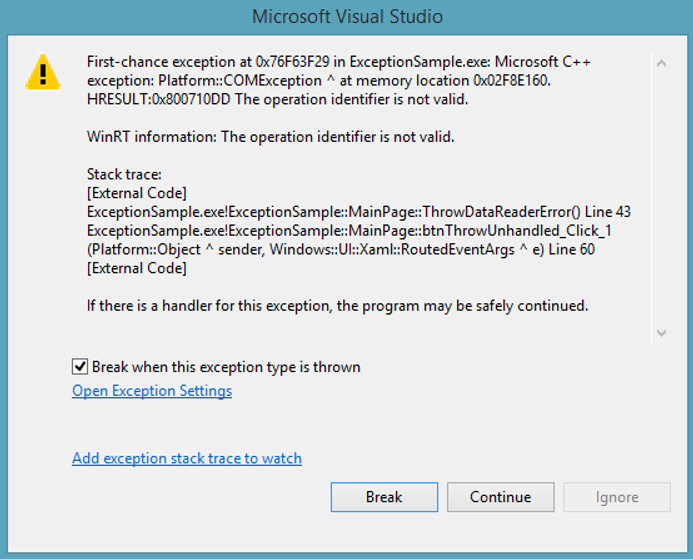
The frames that read “[External Code]” indicate ‘Just My Code’ setting is enabled in the debugger so that only the user code portion of the exception stack is shown. (Just My Code is new for native debugging in Visual Studio 2013 and more details about the new feature can be found in the blog post “Just My Code for C++ in VS 2013”). There is also the new link at the bottom to “Add exception stack trace to watch” which adds the new $exceptionstack pseudovariable to the watch window. This new pseudovariable is further explained in the next section.
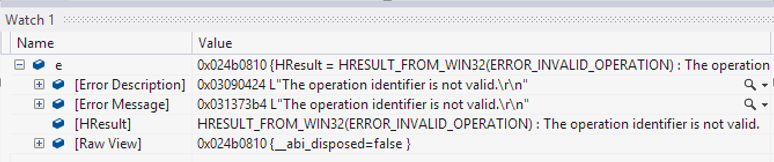
If you continue execution and hit the breakpoint inside the catch block, you can inspect the exception object. Visual Studio 2012 has the following details for the exception:
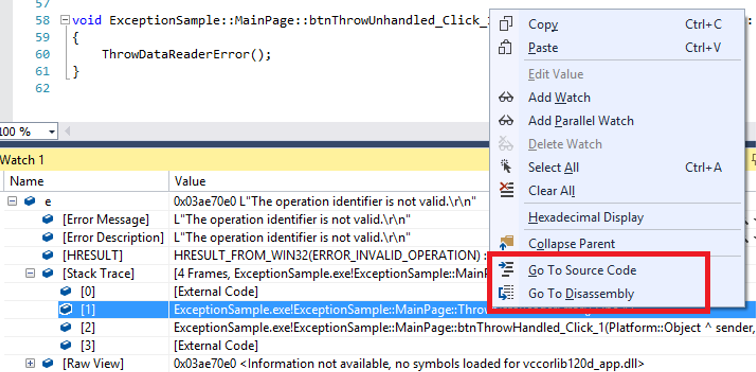
whereas Visual Studio 2013 has the additional stack trace information:
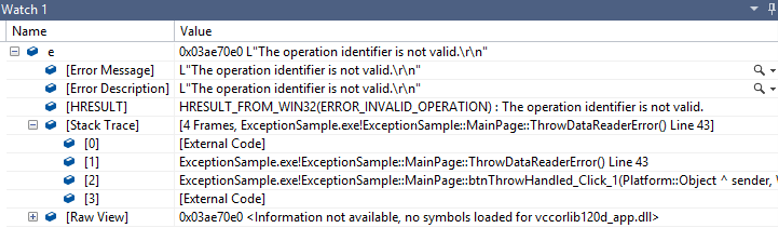
In addition to just being able to view the stack frames for the exception, you can navigate to source code for a frame in the exception stack by using the “Go to Source Code” option in the context menu:
$exceptionstack
$exceptionstack is a new pseudovariable that can be used in the debugger variable windows (Locals, Watch, QuickWatch etc.). It is available for C++ Windows Store Apps and displays the captured stack of the most recent exception on the current thread.
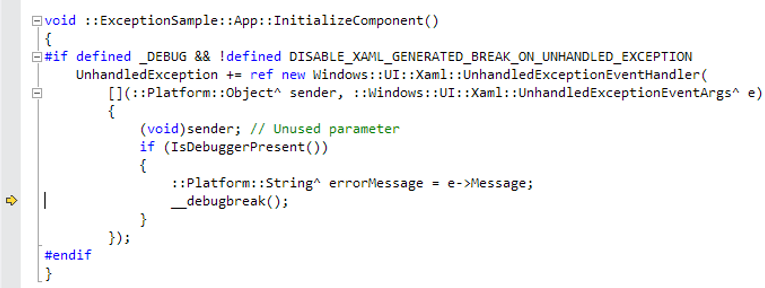
To see how it works, start the sample application under the debugger again and this time click “Throw Unhandled” button. The event handler code for this button calls the same ‘ThrowDataReaderError’ method as in the previous example but doesn’t handle the error raised by the method. After continuing execution on the first-chance exception, you are going to end up in the auto-generated unhandled exception event handler:
With Visual Studio 2012, there is no means for the developer to retrieve the original call stack of the exception at this point. With Visual Studio 2013, you can add the $exceptionstack variable to the watch window to see the last captured stack which allows you to understand how you ended up at that unhandled exception event handler:
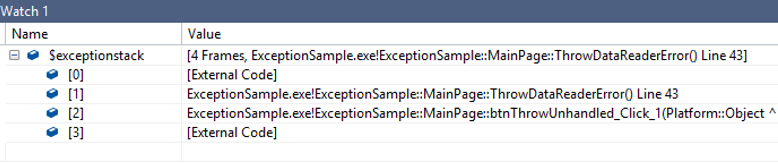
Just as you can navigate to individual frames for an exception object’s captured stack, you can go to source for the frames inside the $exceptionstack variable. Also, when there is an exception stack available, the Locals window will automatically have the $exceptionstack variable added to it.
Task creation stacks
For those exceptions that happen inside tasks and go unobserved, there is one more piece of information that can be important to capture (especially if an exception stack trace is unavailable), which is the task creation stack.
If you run the sample application under the debugger and click on “throw inside task” button, the following code snippet is run where dataReader object attempts to read past the file (dataReader->ReadString(100)):
void ExceptionSample::MainPage::ThrowDataReaderErrorInsideTask()
{
create_task(KnownFolders::DocumentsLibrary->CreateFileAsync(L”foo.txt”,
CreationCollisionOption::ReplaceExisting)).then([this](StorageFile^ file)
{
create_task(file->OpenAsync(FileAccessMode::Read))
.then([this](IRandomAccessStream^ readStream)
{
DataReader^ dataReader = ref new DataReader(readStream);
create_task(dataReader->LoadAsync(100))
.then([this, dataReader](unsigned int numBytesLoaded)
{
String^ fileContent = dataReader->ReadString(100);
OutputTextBlock->Text = fileContent;
delete dataReader;
});
});
});
}
void ExceptionSample::MainPage::btnThrowInsideTask_Click(Platform::Object^ sender, Windows::UI::Xaml::RoutedEventArgs^ e)
{
ThrowDataReaderErrorInsideTask();
}
When this exception goes unobserved, the debugger will stop inside the destructor for the ExceptionHolder object in ppltasks.h:
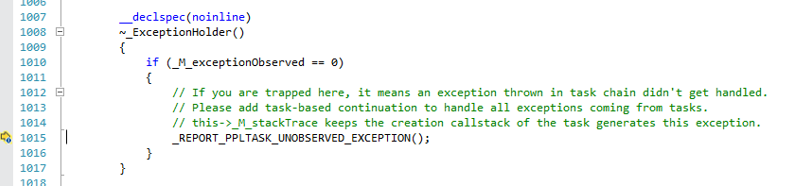
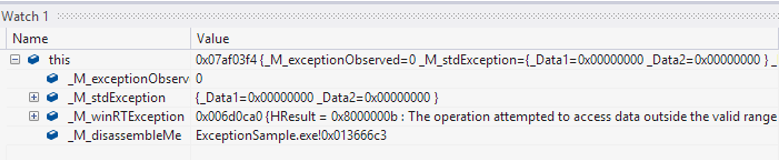
This object contains valuable information for the exception that went unobserved inside the task and can be viewed in the watch window. Visual Studio 2012 shows the instruction pointer for the top of the creation stack frame (_M_disassembleMe) and requires the user to search for the location in the disassembly window:
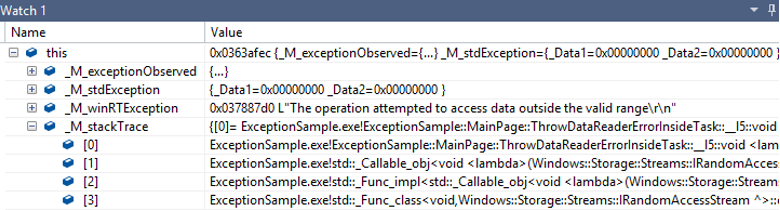
In Visual Studio 2013, _M_disassembleMe is replaced with _M_stackTrace which adds the full stack trace information for the task creation stack as shown below. The developer can easily navigate to source code for a frame listed in the creation stack.

In Closing
I hope you appreciate these improvements in Visual Studio 2013 and Windows 8.1 for diagnosing issues when platform exceptions get thrown. Feel free to download and play with the sample project. I look forward to your feedback in the comments below or in our MSDN Diagnostics Forum.
 Light
Light Dark
Dark
0 comments