
Graphics Diagnostics in Visual Studio 2013 Update 3 RC
Hello again! Three months have passed since we talked about what’s new for Graphics Development in Visual Studio 2013 Update 2. Since then the team has been working to bring even more Graphics Diagnostics features into Visual Studio. I’m very excited to share with you what we have put in Visual Studio 2013 Update 3 RC that just shipped! (Download VS 2013 Update 3 RC, Brian Harry’s announcement blog post, and release notes).
Visual Studio Graphics Diagnostics (VSGD) is a tool to help diagnose graphics rendering and performance issues in DirectX apps. It can be launched by using the menu DEBUG->Graphics->Start Diagnostics or Alt+F5 on the current solution or an exe in VS. If you haven’t used or read about VSGD before, Graphics Diagnostics Overview is a good start. Here is a high level summary of what’s new in VSGD in VS 2013 Update 3 RC:
- New Visual Studio Graphics Analyzer IDE: A dedicated space for analyzing graphics frames
- Shader Edit and Apply: View the impact of shader code changes in a captured log without re-running the app
- Configure capture options in TOOLS->Options->Graphics Diagnostics
- Command line tool for capturing and playing back frames
If you prefer to watch these features in action, check out the latest Channel9 video where I demo the following features. As a bonus, you’ll also see team members who are behind this feature as well as what our offices look like in this video. J
New Visual Studio Graphics Analyzer IDE: A dedicated space for analyzing graphics frames
We heard your feedback that the Capture Frame button wasn’t the easiest thing to find; we heard your feedback that managing various graphics tool windows inside the VS IDE wasn’t easy. So, we made a number of changes to the experience and hopefully you’ll like them.
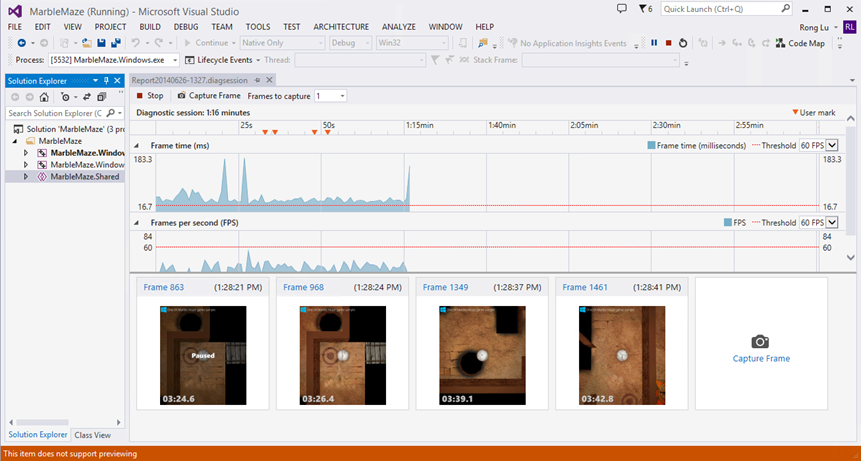
First of all, the Graphics Diagnostics tool is now running in the Performance and Diagnostics hub to provide a consistent view with other diagnostics tools you might be familiar with such as CPU Usage and Memory Usage (although the Graphics Diagnostics tool is only available via the DEBUG -> Graphics menu and cannot be started from the hub launch page). In the upper part of the session file, there is one swimlane for Frame time and another one for FPS which would give you an idea of how fast your app is running. The red line marks the threshold value which you can configure in the dropdown for each swimlane. By default it’s set to 60 FPS. The bottom part lists the frames captured in the current session along with a BIG Capture Frame button in case you didn’t notice. J
We also improved the experienced for analyzing frames. It has been a challenge for us to try to find a better way to help you easily manage the various graphics tool windows in the VS IDE. We explored many options for how to provide a focused environment for analyzing frames without interfering with other tasks that might be going on in the VS IDE, and so here is the new experience in Update 3 RC:
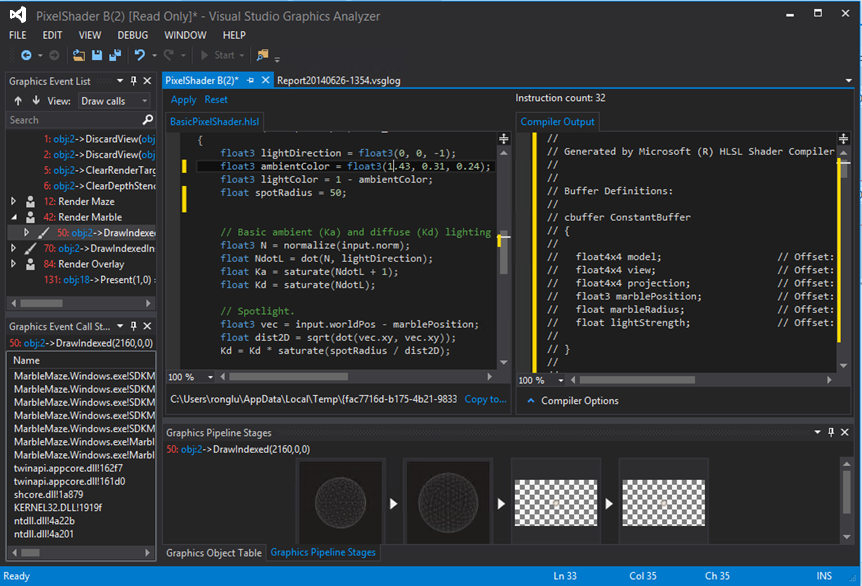
Once frames are captured, double clicking on any frame in the diagsession file, or just clicking on the Frame# link will open the frame in another instance of VS named Visual Studio Graphics Analyzer (VSGA). VSGA is a customized VS environment that only contains the necessary components for analyzing frames. It’s lightweight and has a low memory footprint. It provides a familiar (it’s the same VS Shell!) yet highly focused environment for analyzing frames in which you can access all the related information the same way you used to, including Event List, Pixel History, Pipeline Stage, Objects, Event Call Stack, and debugging shader code. You can also configure how VSGA looks so it’s easier to distinguish it from your regular VS IDE window by using VIEW->Options page in VSGA. Notice the VSGA window in the screenshot is using the dark theme while VS is using the light theme.
You can save the diagsession file in VS or save the vsglog file in VSGA for later inspections.

Shader Edit and Apply: View the impact of shader code changes without re-running the app
The shader editing experience has also been improved with new shader Edit & Apply functionality as well as a side by side view of shader source code and compiler output disassembly code.
Clicking on the shader file name in the Pipeline Stages window or the Pixel History window will open the shader editor. On the left of the side by side view it shows the source code if available and on the right side it shows disassembly code generated by HLSL Shader Compiler. You can make changes in the source code, and once the tool detects differences in output, the Apply button at the top will be enabled. Click Apply to apply the changes to the current vsglog file and you can view how the changes impact the rendering result immediately, including Render Target view, Pipeline Stages, and Pixel History windows.
A few things to call out:
- The source code being edited here is a copy of the original shader file and we keep it in a temporary location (the path is underneath the window) and changes are only applied to the vsglog file and does not affect your original source. You can use the vsglog file as a “playground” to try out different shader effects and view their impacts. The changes can be easily reverted back to when the frame was captured by clicking the Reset button. If you’re satisfied with the changes and want to move the changes to the original source, you can use the Copy to… button which brings up a dialog where you can specify the location of the source file we should copy these changes to.
- During shader debugging, you can make changes to the shader code, but the Apply button will only be enabled after debugging is stopped.
Configure capture options in TOOLS->Options->Graphics Diagnostics
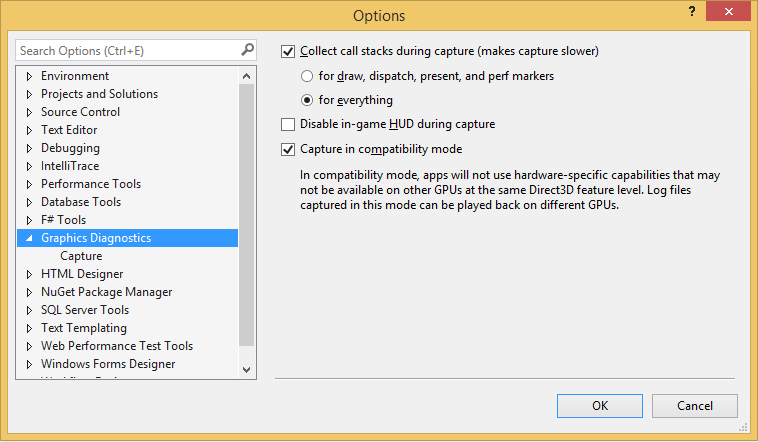
We are now exposing a number of options for capture which you can find by opening TOOLS->Options->Graphics Diagnostics page in VS. Note it’s not in the VSGA IDE, which was designed for analysis only. J You can now decide whether to collect call stacks, whether to disable HUD, or whether to capture in compatibility mode.
Command line tool for capturing and playing back frames
We heard your feedback that sometimes you need to capture frames on machines that don’t have VS installed. We’re now shipping a command line tool for capture and playback (dxcap.exe) as part of Windows SDK. Since the Windows SDK comes with VS, you’ll already have it if you install VS. You can use this tool to capture frames from desktop apps, store apps, and phone apps.
Once you installed VS 2013 Update 3 RC (Download) or standalone Windows SDK (Download). You can find dxcap.exe in C:\Windows\System32 and C:\Windows\SysWOW64. Simply pass in -c and the name of the exe to capture and –p to playback the most recent captured log.
A quick example:
To capture frame 100 from a desktop app: dxcap.exe –frame 100 -c “C:\TestProjects\MyApp.exe”
To playback: dxcap.exe -p
There are more options that can be used, such as to specify which frames to capture, whether to capture in compatibility mode, or what to use as the output filename. You can find details in DXCap’s help information (Dxcap /?) or MSDN document Command-Line Capture Tool .
Summary
As always, we look forward to hearing what you think. Download Visual Studio 2013 Update 3 RC (Download), try it out, and let us know. J
 Light
Light Dark
Dark
0 comments