(image)
Pure Virtual C++ is our free one-day virtual conference for the whole C++ community. This year it will run on April 30th 15:00 UTC. Sign-up for free to get access to our five sessions on the day and a host of pre-conference content which will roll out in the two weeks leading up to the conference.
The sessions are:
Automated...
GitHub Copilot serves as an AI-powered coding assistant capable of operating across various development environments, assisting you with your everyday coding challenges. In this new series of content, we will demonstrate how GitHub Copilot functions in Visual Studio especially and how it boosts your efficiency.
We just published "Using ...
GitHub Copilot your AI-powered coding companion is now seamlessly woven into your Visual Studio IDE, enhancing your everyday tasks and bringing you the latest AI-driven coding experiences. Copilot is designed to elevate your efficiency, by offering personalized code suggestions, crafting your git commit messages, answering coding-related ...
A step-by-step guide to use comments as prompts in GitHub Copilot for Visual Studio. GitHub Copilot is a programming assistant that uses AI (Artificial Intelligence) to help you increase efficiency in your daily programming tasks. ...
A step-by-step guide to enable the AI-powered coding assistant within Visual Studio Introduction to GitHub Copilot. GitHub Copilot is a new tool that helps you write code faster and smarter with the help of artificial intelligence. It can suggest code completions, generate code snippets, and even write entire functions for you. ...
Visual Studio LIVE! Chicago 2024
April 29 - May 3 | Swissôtel, Chicago
Join us for Visual Studio LIVE! Chicago for a focused, deep dive into the latest .NET Microsoft Platform developments. You pick the package you want, 3, 4 or all 5 days! This year, we're at the Swissôtel Chicago, with sessions covering Microsoft Visual Studio 2022...
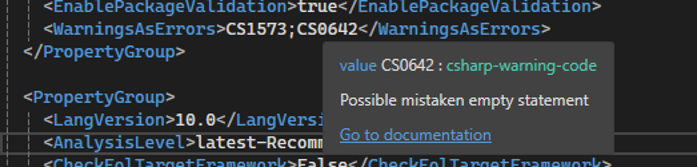
MSBuild is a fundamental part of the .NET development experience, but it can be challenging to new and experienced developers alike. To help developers better understand their project files and access advanced functionality that requires editing the project file directly, we’re releasing an experimental MSBuild editor that has a much richer...
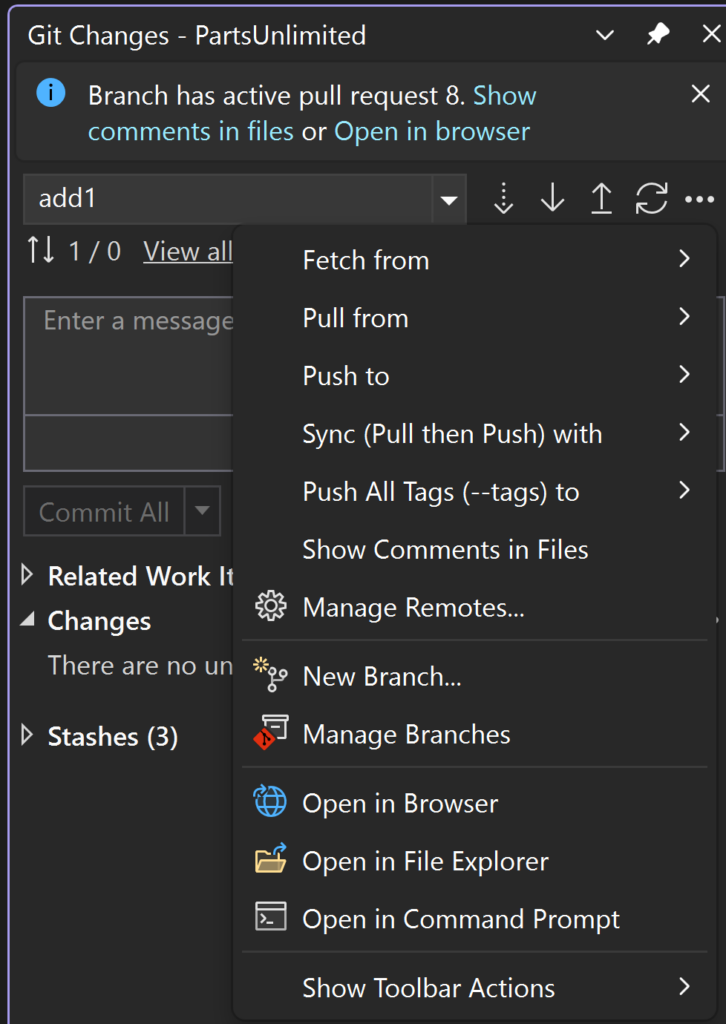
We just shipped preview support for viewing your GitHub and Azure DevOps pull request comments directly in your working file in Visual Studio in 17.10 Preview 2. As one of the most highly requested Git tooling feature suggestions on Developer Community, we need your help to make sure we're on the right track!
Download the Latest Visual ...
We are thrilled to announce the launch of SQL Server Data Tools (SSDT) for Visual Studio in ARM64. This enhancement comes with the exciting release version 17.10 Preview 2. Release of SSDT for Visual Studio on arm64 adds SQL development to the capabilities of Visual Studio on arm64. This latest development brings a host of features tailored to...
Join us on Wednesday, March 20th, 2024, at this year’s Game Developers Conference in San Francisco for a special session on using Visual Studio and GitHub Copilot. In this session, you will learn how to leverage these tools to increase your productivity and modernize your game development workflow.


 Light
Light Dark
Dark