Debugging Contracts using Windows Simulator
All of you might be pretty busy discovering what Windows 8 has to offer. Today I will introduce you to debugging Contracts, one of the cool features in Windows 8.
It is hard to debug contracts when you are debugging locally because they disappear as soon as the focus is lost. So, as you hit a breakpoint in Visual Studio for your app, the target app would disappear making it difficult to debug your app.
Visual Studio 11 Developer Preview ships with a Windows Simulator. The Simulator helps with debugging contracts as it’s a separate session and the target app does not disappear on switching focus to VS. Simulator is also useful in debugging switching between landscape and portrait modes, targeting various device sizes and resolutions, and emulating touch points.
I will use the JavaScript Share Source Sample App and Share Target Sample App (provided by the Windows Developer Preview Metro style apps samples) for my demonstration.
Using Local Debugging
- After downloading and unpacking the sample, open the solution ShareSource.sln in Visual Studio 11 Developer Preview.
- Once the solution is loaded, press F5 to start app locally.
- When the App is running, you can switch to Visual Studio, stop debugging and close the solution. We don’t need to debug the Source App for our illustration. We just need to have it deployed.
- Now open the solution ShareTarget.sln in Visual Studio.
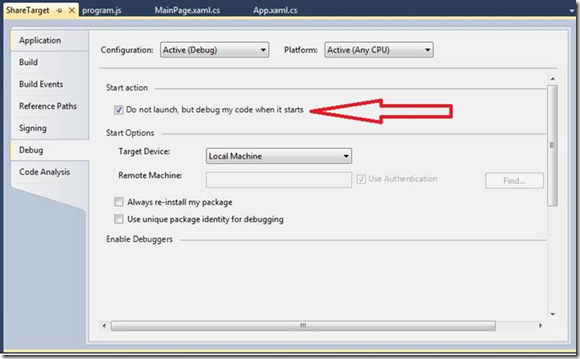
- Change the project properties (Right click on the Project in the Solution Explorer and then click Properties) and set the value of Launch Application under Debugging tab to No. This should register the application for debugging. While Visual Studio will not launch the application, it will start debugging the application whenever it is activated.
If you are using C#/VB project, make sure to select the following option under Debug tab.
Open the file target.js and put a breakpoint in the method activatedHandler as shown below:
6. Press F5 to start debugging.
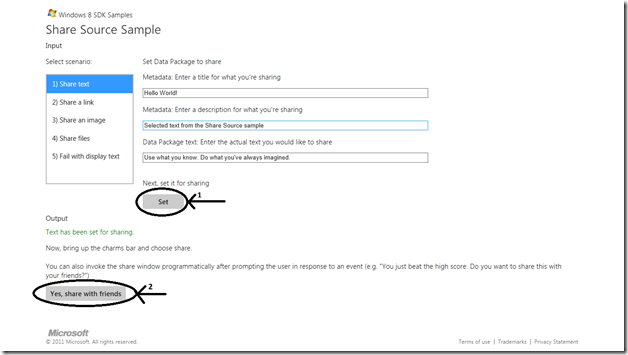
Go to the Start screen and search for Share Source Sample App. As Share Source Sample App becomes active, share some text as shown below:
List of target apps for share contract will appear on the right side, and from the list of available apps select Share Target Sample App.
You will notice that as soon as you hit the breakpoint, target app will disappear making it hard to debug your code.
Using Windows Simulator
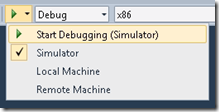
Now let’s try the same thing using Windows Simulator. Press Stop Debugging in Visual Studio 11 Developer Preview and start debugging again using Simulator.
Once the Simulator is up and running and your Share Target Sample App is active, click on the Windows button in the Simulator to go to the Start screen, and search for Share Source Sample App. As Share Source Sample App becomes active, start sharing with the Share Target Sample App using same steps described earlier.
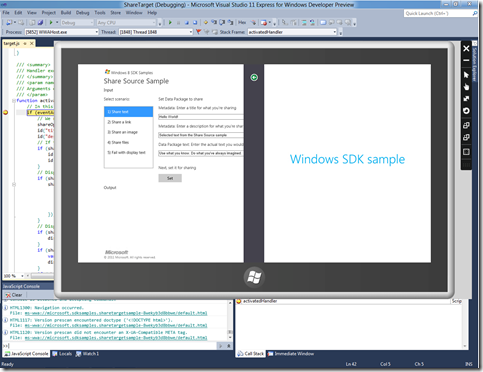
You will notice that target app is still visible in the Simulator after breakpoint is hit. Continue debugging using F10, and you can still observe your target app in parallel as seen below.
I hope you will find this post useful for debugging contracts.
Thanks, Ravneet Singh Khalsa Software Design Engineer, Visual Studio


 Light
Light Dark
Dark
0 comments