
JavaScript Debugging Enhancements
Visual Studio 11 Beta introduces a first class JavaScript development experience and provides a rich toolset for developing Windows Metro style apps. Debugging is a crucial part of that toolset. In this post I am going to focus on just some of the new scenarios and enhancements we’ve added to JavaScript debugging experience for this release.
First chance exceptions
In previous versions of Visual Studio you could only break on unhandled exceptions when debugging JavaScript code. Now, for a given exception type, there is an option to break on exception whenever it is thrown. This is done by enabling the corresponding checkbox under Thrown column in the Exceptions dialog (accessible through Debug -> Exceptions menu command). The other column, “User-Unhandled”, does not apply to JavaScript debugging and is therefore disabled (it applies only to CLR exceptions and is used during managed debugging with “Just My Code” on).
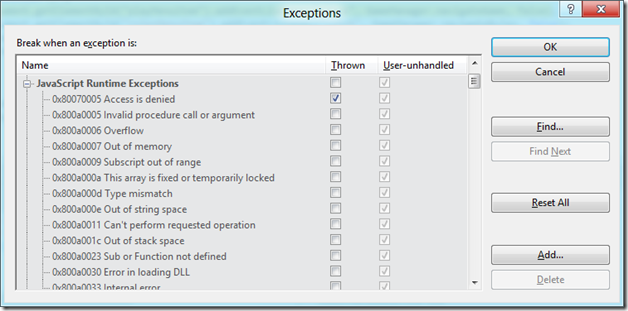
The default settings enable first chance exceptions for certain error types (for example: Object doesn’t support this property or method). When the whole JavaScript Runtime Exceptions category is checked under Thrown, debugger will break on all runtime errors even if they are not listed in the dialog.
First chance exceptions is an important tool when debugging Windows Metro style apps with asynchronous code that uses promises. An exception thrown in a function passed to the then method in a promise is normally “swallowed” by the promise and may not be seen by the developer, especially if there is no error handler passed to the promise chain. With first chance exceptions on, this will now be caught by the debugger and you will break at the throwing statement:
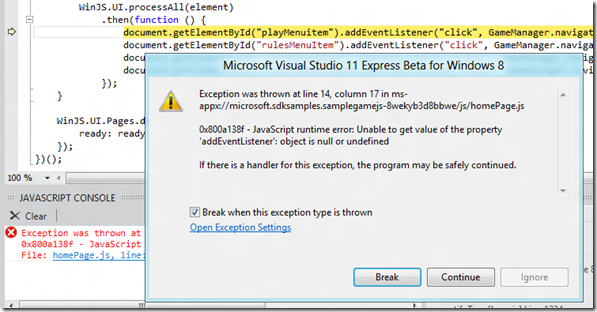
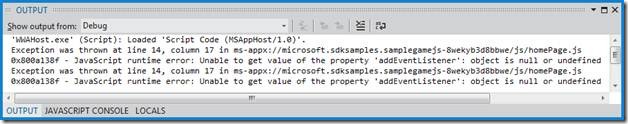
In the example above the element ID is misspelled so document.getElementById returns null which results in an “Object expected” exception for which first chance is enabled by default. You can disable first chance exceptions for that particular error type right from the exception thrown dialog by unchecking the checkbox that says “Break when this exception type is thrown”. That way debugger won’t break next time when that exception type is thrown. The Debug Output window will still contain the information about all thrown exceptions:
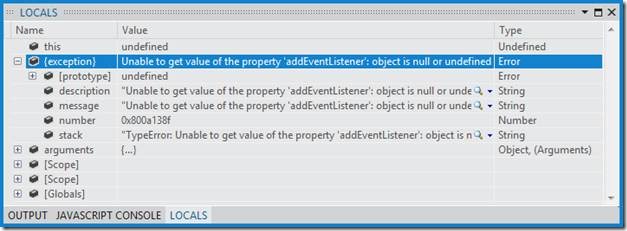
When breaking on an exception, the Locals window shows the thrown exception object as {exception} which you can expand to see its properties. The number property is what defines the exception type in the debugger exception settings.
Debugging web workers
JavaScript Metro style apps and web apps running in IE10 can use web workers for running JavaScript code in the background. Visual Studio 11 Beta has complete debugging support for web workers. When breaking in the Page context or a worker context, other contexts also stop running. The current context where a break event occurred is shown in the Debug Location toolbar. Page context is shown as the Main Thread whereas a worker context shows the URI of its source document in the thread name.
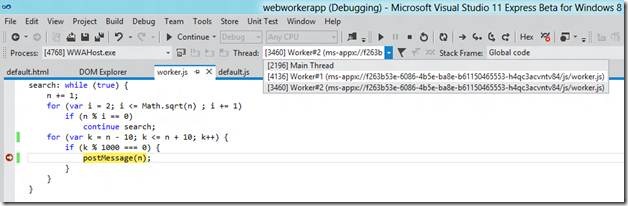
Switching to a different context while in break mode is not possible: other contexts are suspended but their location is undefined. You can break in a different context by stepping or hitting a breakpoint or exception there.
Other enhancements
- Stepping through code during JavaScript debugging shows a significant performance improvement compared to Visual Studio 2010.
- Remote JavaScript debugging is now supported (both on x86/amd64 and ARM remote devices): you can launch JavaScript Metro style apps on a remote device or attach to remote processes running JavaScript code.
- DOM Explorer and JavaScript Console are two new tool windows, similar to those found in Internet Explorer’s F12 Developer Tools, accessible through Debug -> Windows menu. These windows allow you to work with a running app and try out modifications to styles, the DOM, or code against the running app through the console. In addition, you could make use of the JavaScript APIs for console.log, to record specific events to the console, as you debug.
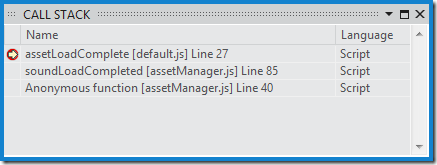
- The Call Stack window includes more information such as the line and source file information, giving you more context as you debug without the need of frequently switching to other frames.

Summary
These are some of the enhancements of JavaScript debugging experience we’ve added with Visual Studio 11 Beta as part of vast improvement in tooling support for JavaScript. As always, we want to hear your feedback. Please report issues through the Visual Studio Connect site. You can add new suggestions for further improvements to UserVoice or vote on existing ones.
 Dmitri Leonov – Software Development Engineer in Test, Visual Studio Ultimate team.
Short Bio: Dmitri Leonov joined the Visual Studio team in 2008. He has been working on the Debugger team since then, where he is now focusing on JavaScript debugging experiences.
 Light
Light Dark
Dark
0 comments