
Visual Studio 11 Performance: Improvements in Typing and Editing Responsiveness
After the beta release, we published several posts on the performance improvements in Visual Studio 11. Since the beta release, we have made a number of additional enhancements, continuing our quest to improve the performance of Visual Studio. The performance work done between beta and the upcoming RC was substantial and covered many aspects of the product including XAML (compiler, loading documents, and the design surface), C++, TLM, Debugging and the list goes on. We plan to blog about a few examples. In this post we’ll cover typing responsiveness, and in the next post we’ll cover the Toolbox – both of which are areas that have a broad impact on Visual Studio performance. We are excited for you to experience Visual Studio 11’s performance improvements in the upcoming RC release and without further ado I would like to introduce Eric Knox from the Visual Studio Pro Team to describe to you the work done to improve typing responsiveness for you.
As previous posts on Visual Studio performance have stated, we spent a great deal of time looking across the breadth of Visual Studio for areas to improve. In this post, I’ll describe how we approached measuring and improving the typing and editing part of the “edit-compile-debug” loop, due in large part to the UserVoice suggestion to make typing and scrolling more responsive. I’ll share the techniques we’ve developed for assessing Visual Studio’s responsiveness and some of the results we’ve achieved with the measurement style we developed.
What is responsiveness?
As you most likely know, Windows applications are message-based, meaning that all interaction, whether it’s a typed character, a mouse move or a request to paint is sent to an application’s message loop. If an application spends more time handling a given message than it takes the user or Windows to generate the next message, an application can start falling behind and become “unresponsive.”
How do we measure and evaluate responsiveness?
Since responsiveness is all about whether or not VS is keeping up with the incoming message stream, it is fairly straightforward engineering work to figure out how long any given message takes to process. During Visual Studio 2010 SP1, we added some hooks into the product so we could tell when processing a single message took too long. We released an extension called PerfWatson that recognized unresponsiveness and generated anonymous reports that we collected and aggregated. You can read this earlier blog post about how we used PerfWatson data during Visual Studio 11. One of the most interesting things to know about PerfWatson for today’s post is that it collects a mini heap dump which allows us to figure out what Visual Studio code is running at a particular point during the delay.
PerfWatson has been an extremely valuable tool for understanding VS hangs, but the threshold we set for it and the dump files it collects are designed for general application responsiveness, not for interactions that must be immediate such as typing a character and seeing it appear on the screen. Collecting a dump is fast, but it’s not fast enough to repeat on a per-keystroke basis. We therefore built a more fine-grained measurement system we call Immediate Delay Tracker (IDT).
Both PerfWatson and IDT are aimed at assessing responsiveness, but they achieve that result in different ways. PerfWatson can tell what code was running at a point in time during a single message’s processing by programmatically translating the mini heap dump it collects into a single call stack. Collecting that dump and translating it into a call stack is a modest amount of work both in terms of how much data it collects and how much processing power it takes. IDT, however, is based off of Event Tracing for Windows (ETW) which doesn’t take a lot of processing power either but does collect a lot more information than a single call stack. ETW enables Windows to record events and other data important to knowing exactly what was happening during the profiled time period in a low-overhead manner, saving that data into an output trace file (ETL file). One of the main things ETW gives us for analyzing CPU-bound work is a sampled profile of what a computer was doing while we collected a trace. Instead of a single stack like PerfWatson, we can get a call stack every millisecond and then analyze the collection of stacks in aggregate rather than just a single point in time. When a particular function is present across a majority of samples, it is likely that function spent a lot of time processing and is a great place to optimize or even eliminate where possible.
The other thing to know about ETW is that while it is designed to be low overhead when collecting a trace, it’s also designed to have as negligible an impact as possible when ETW is not actively collecting a trace. That enables VS engineers to decide what kinds of events would be interesting to record in an ETL file without negatively influencing VS running on customer machines where ETW is unlikely to be collecting a trace. Having the product give an indication of exactly what event is occurring, combined with a sampled profile, allows us to pinpoint the exact periods of time we need to focus on when trying to make a particular scenario faster.
IDT is the tool that combines the ability to turn on ETW tracing along with awareness of some key events to give us visibility into high-frequency, short-duration scenarios. The in-product events IDT is aware of are numerous and include things like the time to process an individual keystroke, how long it took a menu to open and even how long it took a language service to color the code on the screen. With the ETW setup and registration in place, IDT is able to know exactly when these kind of immediate operations happened, how long they lasted and give us a report of how long these “instant” operations took in aggregate.
Knowing how long a set of “instant” operations took is a great step, and having that data enables us to evaluate a developer scenario and say whether actions such as keystroke processing met our expectation or not. But when investigating a scenario that did not meet our expectation, it was difficult to look at the numerous, very short windows of time when VS was processing a message to figure out what VS was doing in aggregate. To help make sense of the data within the trace, the team built another tool on top of the IDT infrastructure that we call RaceTrack.
RaceTrack’s main job is to analyze ETL files in a way that allows us to focus on just the time period during the specific events we care about, such as keystroke processing. On top of narrowing down to a single specific event, RaceTrack also has the ability to merge multiple sampled profile periods together so that the code paths which show up most often across multiple occurrences rise to the top of our visibility, exactly like a sampled profile stitches together individual samples over time to show which functions spent a significant amount of time processing.
To use a concrete example, we used RaceTrack to collect an ETL file while some automation code opened a very large C# solution and typed a few thousand characters of valid code into a file. With RaceTrack, we can see things like which character in the input stream had the longest delay, or we can aggregate all the delays together to see what our biggest bottleneck was across all keystrokes. In this screenshot, you can see RaceTrack showing a number of “Input Delay” events at the top which represent characters typed, along with their duration and even what time of day they happened. The bottom pane shows that I’m looking at an aggregated stack of two events, breaking down what percentage of the combined delays were spent in the call stacks on the right.
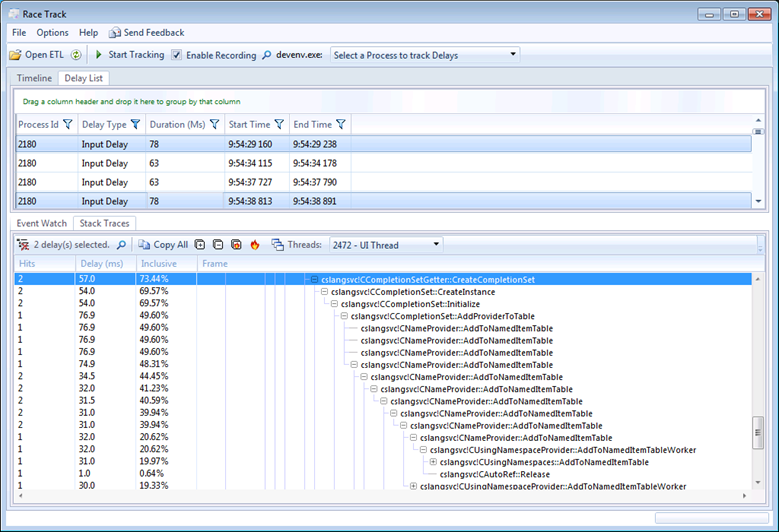
For C#, it turned out that we were doing some aggressive calculations to figure out what to put in the completion list in order to help provide the right experience of knowing what you could legally type next. With this kind of focused data, we were able to rethink parts of what we were doing during each keystroke, optimizing some of our common code paths as well as eliminating some that we didn’t need to be doing at all.
Once we had that kind of tool and data in front of us, we were able to more effectively reason about what each language service was doing and make improvements. Here are the results of just three of our language services, expressed as a percentage of keystrokes above a given millisecond threshold. For the purpose of VS reacting instantly, lower is better:
|
|
Visual Studio 2010 |
Current |
|
|
C#
|
Keys above 50ms |
15.05% |
7.87% |
|
Keys above 100ms |
10.26% |
0.62% |
|
|
Keys above 200ms |
1.50% |
0.06% |
|
|
C++
|
Keys above 50ms |
11.85% |
0.48% |
|
Keys above 100ms |
7.88% |
0.20% |
|
|
Keys above 200ms |
6.85% |
0.07% |
|
|
VB
|
Keys above 50ms |
0.83% |
0.60% |
|
Keys above 100ms |
0.13% |
0.06% |
|
|
Keys above 200ms |
0.06% |
0.06% |
|
And here’s an alternate view that more graphically represents how many characters were processed in less than 50ms (the gray of the pie chart) and how the spread of characters above 50ms falls into buckets that we found meaningful (the bar chart). Notice that each language has the same scale for in the before and after bar charts, but the scale between languages is different.


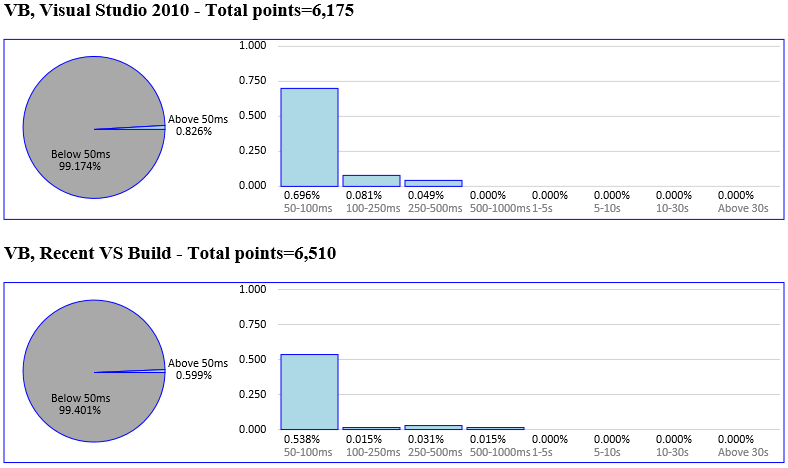
The main caveat from this data is that each language is using a large, representative solution, but this one test is by no means an exhaustive measurement of all typing in those languages. Your mileage may vary compared to what we’ve measured on our moderately-powered machines where we do regular measurements. If your local results don’t mesh with these numbers, you can find out how to help us diagnose problems toward the bottom of this post in the “Next Steps” section.
Having given the caveat, the main takeaways from this data are:
- C++ made huge improvements with 99.5% of characters being processed in less than 50ms
- C# isn’t perfect yet, but it’s gotten significantly better with 99.4% of characters being processed in less than 100ms. The bar chart does a good job of showing that while not all characters are processed in less than 50ms, a large number have been “compressed” to be processed in noticeably less time than Visual Studio 2010
- VB was already quite responsive in Visual Studio 2010 but has still managed to squeeze some more responsiveness times out of per-keystroke delays
Ongoing Responsiveness Tracking
In addition to repetitively running a single test per language on a daily basis to quantify improvements as well as to prevent regressions, we’ve also deployed an IDT-based monitoring service to internal users within Microsoft in order to get a more exhaustive measurement. This tool runs in the background, watching how long keystrokes and a few other high-frequency, short-duration actions take within VS, counting the number of occurrences within buckets and then phoning that data back home to a central server.
It turns out that the real world follows the trends of what we see above (with C++ performing better than C#), but not surprisingly, our testing lab doesn’t represent the real world exactly. When large numbers of developers use VS regularly across a spread of hardware configurations and usage patterns, we can see a small percentage of data points that I didn’t expect. For example, the first time I ran the report over the collected data, I was shocked to see that some keystrokes took longer than 30 seconds! It turned out that the folks who logged those values worked on the TFS team, and v1 of our service didn’t recognize when modal checkout dialogs came up between the beginning of a keystroke and the end of it.
For full transparency, here’s some data specifically from Beta:
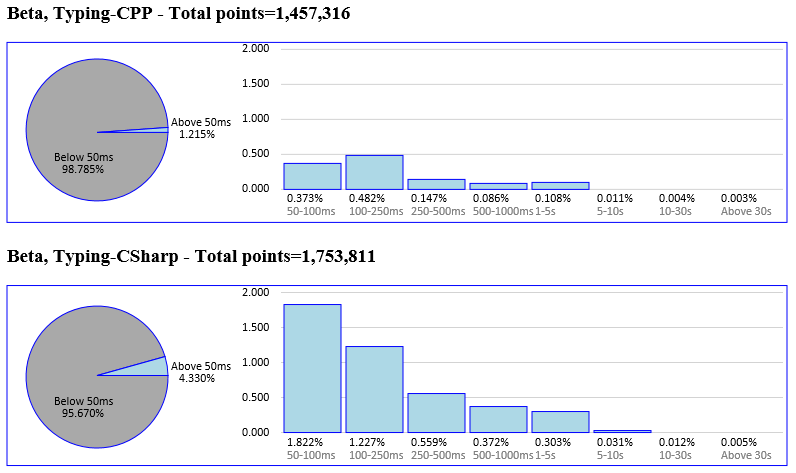
The main takeaways from these charts are:
- This data is from v1 of the service (which didn’t exclude modal UI popping up, when VS was being debugged or when we were running intrusive automation), so looking at the drop-off shape of the non-instant buckets is more interesting than the actual number of outlier occurrences
- C# and C++ have ~1.75 and ~1.5 million keystrokes logged respectively, which I believe is a good start but not large enough to say we have our finger on the pulse of the “real world”
- When comparing C++ to C#, you can see that as expected from our lab results above, C++ was indeed more responsive than C#
- With both languages, you can see that the number of longer-processed characters drops off as the bucket time duration increases
Using this data, we were able to track down some C# users having responsiveness issues. One thing that we found was an issue we fixed in the Beta Update to improve C# responsiveness in large solutions. The issue was a bug where we weren’t differentiating an empty dictionary of async-related extension methods from having no async-related extension methods in the solution. That caused us to search for those extension methods on every keystroke. We missed it because that’s a fast operation when the entire solution either fits within our symbol cache or has a smaller number of extension methods. These users had solutions with lots of non-async-related extension methods in a solution that didn’t fit within our cache. And while we haven’t yet collected enough data to regenerate charts with that fix in place, the qualitative assessment from some of the hardest-hit folks was that C# typing was noticeably more responsive after the Beta Update.
The combination of putting the right telemetry into the product, along with tools that can read and process that data in a meaningful fashion helped us tremendously during the development of Visual Studio 11.
Next Steps
For situations when you want to report a responsiveness problem happening on your machine, we’ve come up with the Microsoft Visual Studio 11 Feedback Tool which can record ETL files. The Feedback Tool knows how to package up the traces along with some other info and send them back to Visual Studio as part of a problem report submission (via Connect) which will make the job of gathering diagnosable information much easier compared to Visual Studio 2010. On our end, once we receive your problem reports about responsiveness in scenarios like typing, we’ll open the ETL files using RaceTrack to analyze what was happening on your machine during actions that should be quick in order to try and resolve your issues.
Altogether, I hope that sharing some of our tools, methodologies and even dirty-laundry stories gives you a better understanding of how we’re working to make sure that Visual Studio 11 is as solid as it can be.
![clip_image002[1]](https://devblogs.microsoft.com/visualstudio/wp-content/uploads/sites/4/2012/05/6320.clip_image0021_thumb_763586B5.jpg "clip_image002[1]") |
Eric Knox – Development Manager, Visual Studio Pro Team
Short Bio: Eric has been at Microsoft for 18 years, working on various parts of Visual Studio for the last 14 years. His current role is the development manager in charge of C#, VB, F# and the Visual Studio editor. |
Coming Up Next
In the next post we will cover the changes the team made to improve the Toolbox and those effects throughout the product. Please let me know where you feel we still need improvement and where you see noticeable performance improvements as well. I appreciate your continued support of Visual Studio.
Thanks, Larry Sullivan Director of Engineering
 Light
Light Dark
Dark
0 comments