Turn on suggestions
Auto-suggest helps you quickly narrow down your search results by suggesting possible matches as you type.
Failover Clustering
URL
Copy
Options
Author
invalid author
Searching
# of articles
Labels
Clear
Clear selected
Active Directory
amitabh tamhane
amith kamath kaup
Azure
cluster deployment planning
clustered file server
cluster infrastructure
cluster migration
cluster sets
cluster shared volumes
cluster troubleshooting
csv series
elden christensen
etw
eventing
Exchange
failover clustering
File Server
generic application
generic resource
generic script
generic script resource
generic service
guest clustering
howard sun
hyper v
hyper v clustering
IIS
john marlin
live migration
management pack
Migration
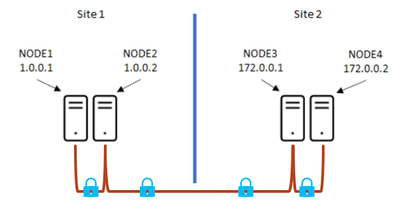
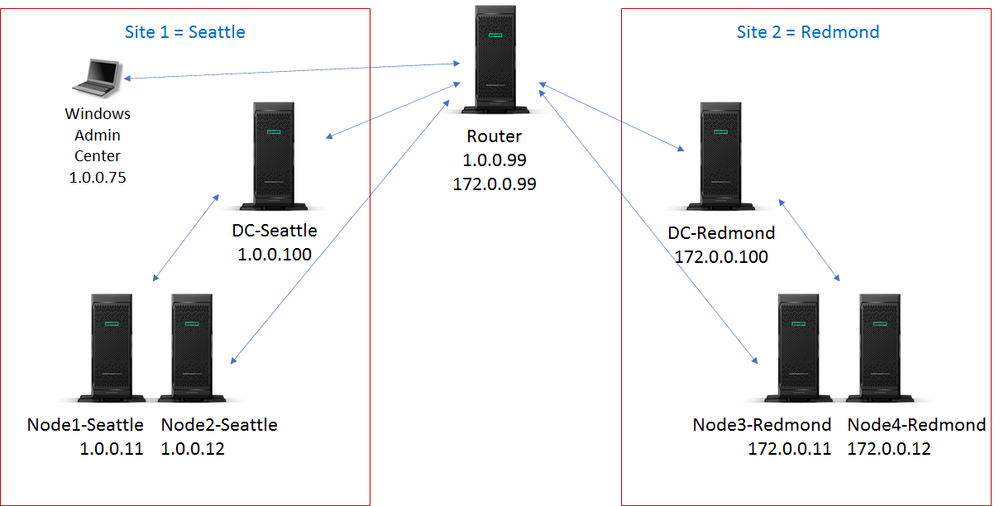
multi site
mvp
Networking
network load balancing
network name
NLB
node fairness
Pages
performance counters
performance monitor
persistent mode
port rule
powershell script resource
print
print server
quorum
Resource
resource dll
rob hindman
scale out file server
SCOM
Security
SMB
sql
steven ekren
Storage
Storage Spaces Direct
stretch cluster
subhasish bhattacharya
sudhir anantha padmanaban
teched
TechNet
Troubleshooting
Upgrade
validate
vip
vladimir petter
Webcast
windows server 2003
windows server 2008
windows server 2008 r2
windows server 2012 r2
Windows server 2016
windows server 2019
witness
wmi scripting
- Home
- Windows Server
- Failover Clustering
Options
- Mark all as New
- Mark all as Read
- Pin this item to the top
- Subscribe
- Bookmark
- Subscribe to RSS Feed

9,124


10.1K

31.1K


12.2K

12.5K
6,745


14K


Latest Comments