Did You Know?
Update 10/24/2013
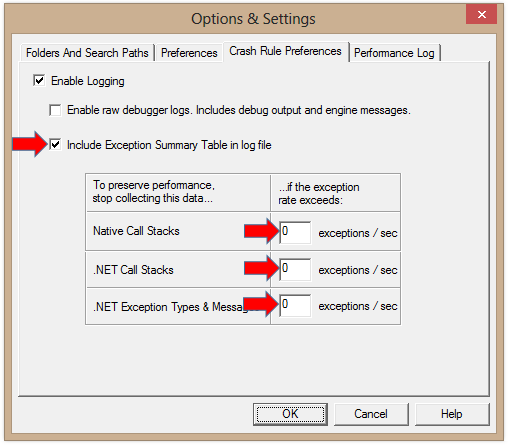
Some customers have experienced a memory leak in dbghost.exe when using this feature (on by default). The issue is not in the tool itself, but is due to a problem in sos.dll. Until an update is available, users can workaround the problem by turning off the feature off in the DebugDiag options. Unchecking the box to include the summary table in the log file doesn't completely address the issue. Instead, set the thresholds to 0 as shown below.
You might not need a dump file anymore
DebugDiag 2.0 introduces a new feature to track exceptions. This feature is very helpful since it provides details on all exceptions thrown during the debugging session. Many times you don’t really need a dump file to
troubleshoot an exception. Instead you may just need the exception Type, Message, and Call Stack. In those cases, simply using an “empty” crash rule may be enough to figure out the root cause of the issue being debugged. An “empty” crash rule is one where you select your target (Executable, IIS Application Pool, Service, etc.), and then just click ‘Next’, ‘Next’, ‘Finish’ without configuring any specific actions such as ‘Create Full UserDump’ or ‘Log Stack Trace’.
This feature is ON by default, and can be turned OFF or configured in the Crash Rule preferences Tab in the Options and Settings Windows under the Tool Menu.
IMPORTANT: This information is only written to the log file at the end of the debug session. Either deactivate the rule or stop the target process to end the debug session.
Performance Details
To avoid affecting performance, only minimal information is logged to disk throughout the life of the process. If the exception rate rises above the configurable thresholds, then the more expensive information is no longer collected (notice the ‘omitted’ sections below). If the exception rate drops below the threshold, the full information is collected from that point forward. The exception details are stored in memory, and the ’Exception Details’ and the ‘Exception Summary’ sections are written to the log file only when the process exits or when a rule is deactivated. Additional memory is only required when a new entry in these summary sections is added. If the same exception repeatedly occurs at the same place in the application, a count is incremented and additional memory is not needed.
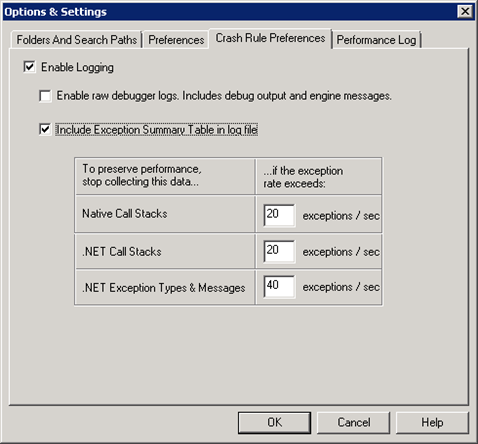
The various options for this feature are found on the ‘Crash Rule Preferences’ tab of the ‘Tools | Options & Settings’ dialog:
If configured, an exception summary table will be included at the end of the rule's log file located now in the rule's folder (the log files are now located with the dump files - this is another new feature in 2.0).
EG: C:\Program Files\DebugDiag\Logs\Crash rule for all instances of DemoApp.exe\DemoApp__PID__6172__Date__09_10_2013__Time_10_48_10PM__153__Log.txt
In this table, a breakdown per exception type and count is displayed. Something like below:
**********************************
* EXCEPTION SUMMARY *
**********************************
|----------------------------------------|
| Count | Exception |
|----------------------------------------|
| 100 | System.IndexOutOfRangeException |
| 100 | System.ArgumentException |
| 100 | System.IO.FileNotFoundException |
| 100 | System.NullReferenceException |
|----------------------------------------|
.
.
.
Only the following information is logged each time an exception is caught:
Date-Time: Date and Time when the exception was thrown.
Exception kind: First or Second chance exception.
Exception Code: Exception Code
Causing Thread ID: ID of the thread that threw the exception
Exception Type: For .NET exception, this is the type of the exception thrown
Detail ID: ID used to classify each exception based on Type, Message, and Call Stack. Use this ID to look up the details in the ‘Exception Details’ section.
An example of this logging follows:
[9/10/2013 10:48:21 PM] Thread exited. Exiting thread system id - System ID: 9872. Exit code - 0x00000000
[9/10/2013 10:48:21 PM] First chance exception - 0XE0434352 caused by thread with System ID: 8832. Type = System.IndexOutOfRangeException. DetailID = 2
[9/10/2013 10:48:21 PM] Thread created. New thread system id - System ID: 10000
[9/10/2013 10:48:21 PM] Thread exited. Exiting thread system id - System ID: 8832. Exit code - 0x00000000
[9/10/2013 10:48:21 PM] First chance exception - 0XE0434352 caused by thread with . Type = System.IndexOutOfRangeException. DetailID = 2
[9/10/2013 10:48:21 PM] Thread created. New thread system id - System ID: 7712
[9/10/2013 10:48:21 PM] Thread exited. Exiting thread system id - System ID: 10000. Exit code - 0x00000000
[9/10/2013 10:48:21 PM] First chance exception - 0XE0434352 caused by thread with System ID: 7712. Type = System.IndexOutOfRangeException. DetailID = 2
[9/10/2013 10:48:21 PM] Thread created. New thread system id - System ID: 7720
[9/10/2013 10:48:21 PM] Thread exited. Exiting thread system id - System ID: 7712. Exit code - 0x00000000
[9/10/2013 10:48:21 PM] Thread created. New thread system id - System ID: 4292
[9/10/2013 10:48:21 PM] First chance exception - 0XE0434352 caused by thread with System ID: 7720. Type = System.ArgumentException. DetailID = 3
[9/10/2013 10:48:21 PM] First chance exception - 0XE0434352 caused by thread with System ID: 4292. Type = System.ArgumentException. DetailID = 3
[9/10/2013 10:48:21 PM] Thread created. New thread system id - System ID: 10976
[9/10/2013 10:48:21 PM] Thread exited. Exiting thread system id - System ID: 7720. Exit code - 0x00000000
[9/10/2013 10:48:21 PM] Thread exited. Exiting thread system id - System ID: 4292. Exit code - 0x00000000
[9/10/2013 10:48:21 PM] First chance exception - 0XE0434352 caused by thread with . Type = System.ArgumentException. DetailID = 3
[9/10/2013 10:48:21 PM] Thread created. New thread system id - System ID: 11700
[9/10/2013 10:48:21 PM] Thread exited. Exiting thread system id - System ID: 10976. Exit code - 0x00000000
[9/10/2013 10:48:21 PM] First chance exception - 0XE0434352 caused by thread with System ID: 11700. Type = System.ArgumentException. DetailID = 3
[9/10/2013 10:48:21 PM] Thread created. New thread system id - System ID: 5308.
.
.
An example of the ‘Exception Details’ and ‘Exception Summary’ sections follows:
.
.
.
[9/10/2013 10:48:32 PM] Process exited. Exit code - 0x00000000
***********************
* EXCEPTION DETAILS *
***********************
DetailID = 1
Count: 1
Type: System.IndexOutOfRangeException
Message: IndexOutOfRangeException.
Stack:
[HelperMethodFrame]
System.Threading.ExecutionContext.RunInternal(System.Threading.ExecutionContext, System.Threading.ContextCallback, System.Object, Boolean)
System.Threading.ExecutionContext.Run(System.Threading.ExecutionContext, System.Threading.ContextCallback, System.Object, Boolean)
System.Threading.ExecutionContext.Run(System.Threading.ExecutionContext, System.Threading.ContextCallback, System.Object)
System.Threading.ThreadHelper.ThreadStart()
[GCFrame]
[DebuggerU2MCatchHandlerFrame]
DetailID= 2
Count: 99
Type: System.IndexOutOfRangeException
Message: IndexOutOfRangeException.
Stack:
[HelperMethodFrame]
DemoApp.Program.IOORException() [c:\DemoApp\DemoApp\DemoApp\Program.cs @ 148]
System.Threading.ThreadHelper.ThreadStart_Context(System.Object)
System.Threading.ExecutionContext.RunInternal(System.Threading.ExecutionContext, System.Threading.ContextCallback, System.Object, Boolean)
System.Threading.ExecutionContext.Run(System.Threading.ExecutionContext, System.Threading.ContextCallback, System.Object, Boolean)
System.Threading.ExecutionContext.Run(System.Threading.ExecutionContext, System.Threading.ContextCallback, System.Object)
System.Threading.ThreadHelper.ThreadStart()
[GCFrame]
[DebuggerU2MCatchHandlerFrame]
DetailID= 3
Count: 100
Type: System.ArgumentException
Message: ArgumentException
Stack:
[HelperMethodFrame]
DemoApp.Program.AException()[c:\DemoApp\DemoApp\DemoApp\Program.cs @ 161]
System.Threading.ThreadHelper.ThreadStart_Context(System.Object)
System.Threading.ExecutionContext.RunInternal(System.Threading.ExecutionContext, System.Threading.ContextCallback, System.Object, Boolean)
System.Threading.ExecutionContext.Run(System.Threading.ExecutionContext, System.Threading.ContextCallback, System.Object, Boolean)
System.Threading.ExecutionContext.Run(System.Threading.ExecutionContext, System.Threading.ContextCallback, System.Object)
System.Threading.ThreadHelper.ThreadStart()
[GCFrame]
[DebuggerU2MCatchHandlerFrame]
DetailID= 4
Count: 31
Type: System.IO.FileNotFoundException
Message: Invalid file argument
Stack:
[HelperMethodFrame]
DemoApp.Program.FNFException()[c:\DemoApp\DemoApp\DemoApp\Program.cs @ 173]
System.Threading.ThreadHelper.ThreadStart_Context(System.Object)
System.Threading.ExecutionContext.RunInternal(System.Threading.ExecutionContext,System.Threading.ContextCallback, System.Object, Boolean)
System.Threading.ExecutionContext.Run(System.Threading.ExecutionContext,System.Threading.ContextCallback, System.Object, Boolean)
System.Threading.ExecutionContext.Run(System.Threading.ExecutionContext,System.Threading.ContextCallback, System.Object)
System.Threading.ThreadHelper.ThreadStart()
[GCFrame]
[DebuggerU2MCatchHandlerFrame]
DetailID= 5
Count: 69
Type: System.IO.FileNotFoundException
Message: Invalid file argument
Stack:
(omitted)
DetailID= 6
Count: 100
Type: System.NullReferenceException
Message: Null String
Stack:
(omitted)
As explained in the beginning of this article, this feature could be disabled if it all affects the performance of the target process. When the feature is enabled, DebugDiag collects the exception code, type, message and callstack for every exception thrown. This may affect performance. We have specified some default values for exception rate per sec where it would be unacceptable in term of target process performance to leave the feature ON. However, these numbers are by no mean a norm.