Special Command—Execute Commands from a Customized User Interface with .cmdtree
A few weeks ago I received an e-mail from Brad Wilson, a Support Escalation Engineer from the OCS (Office Communications Server) team. Brad asked me about the .cmdtree command and I told him I’ve never configured it before. A few days ago he sent me another e-mail saying he figured out how to use this command. I decided to try it and… wow! Pretty cool!
So, here is the thing, you can use this technique to create a window that has your most used commands or those that you never remember how to use. J
Brad thanks for sharing it! Readers, again I repeat myself here: I bet you’re going to like it!
Here are the steps:
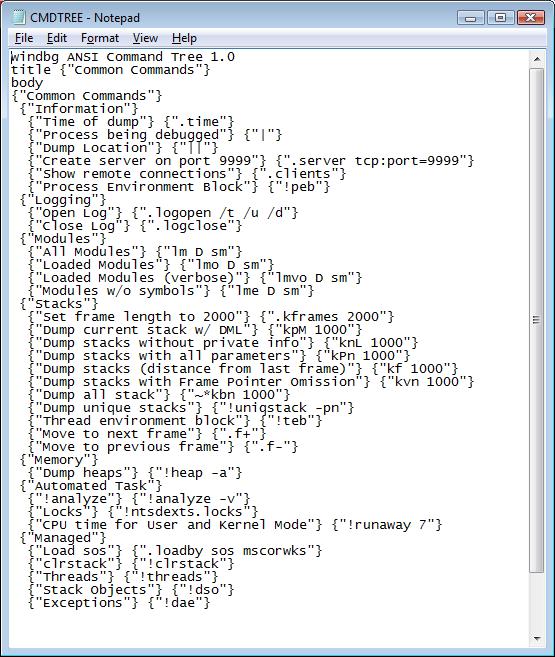
a) Create a text file, CMDTREE.TXT, with your commands, using the example below as a template. You can modify sections between {} the way you want:
windbg ANSI Command Tree 1.0
title {"Common Commands"}
body
{"Common Commands"}
{"Information"}
{"Time of dump"} {".time"}
{"Process being debugged"} {"|"}
{"Dump Location"} {"||"}
{"Create server on port 9999"} {".server tcp:port=9999"}
{"Show remote connections"} {".clients"}
{"Process Environment Block"} {"!peb"}
{"Logging"}
{"Open Log"} {".logopen /t /u /d"}
{"Close Log"} {".logclose"}
{"Modules"}
{"All Modules"} {"lm D sm"}
{"Loaded Modules"} {"lmo D sm"}
{"Loaded Modules (verbose)"} {"lmvo D sm"}
{"Modules w/o symbols"} {"lme D sm"}
{"Stacks"}
{"Set frame length to 2000"} {".kframes 2000"}
{"Dump current stack w/ DML"} {"kpM 1000"}
{"Dump stacks without private info"} {"knL 1000"}
{"Dump stacks with all parameters"} {"kPn 1000"}
{"Dump stacks (distance from last frame)"} {"kf 1000"}
{"Dump stacks with Frame Pointer Omission"} {"kvn 1000"}
{"Dump all stack"} {"~*kbn 1000"}
{"Dump unique stacks"} {"!uniqstack -pn"}
{"Thread environment block"} {"!teb"}
{"Move to next frame"} {".f+"}
{"Move to previous frame"} {".f-"}
{"Memory"}
{"Dump heaps"} {"!heap -a"}
{"Automated Task"}
{"!analyze"} {"!analyze -v"}
{"Locks"} {"!ntsdexts.locks"}
{"CPU time for User and Kernel Mode"} {"!runaway 7"}
{"Managed"}
{"Load sos"} {".loadby sos mscorwks"}
{"clrstack"} {"!clrstack"}
{"Threads"} {"!threads"}
{"Stack Objects"} {"!dso"}
{"Exceptions"} {"!dae"}
b) Save the text file in the same folder your WinDbg is installed. Mine is in c:\debuggers.
c) Open a dump file, load the symbols, then use this command:
.cmdtree CMDTREE.TXT
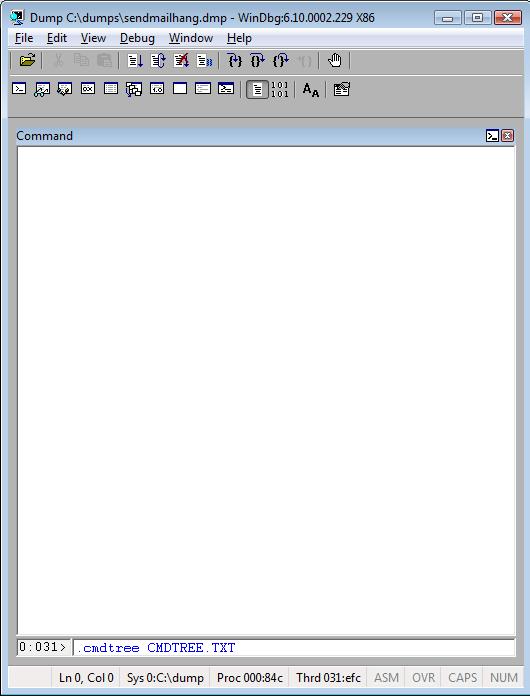
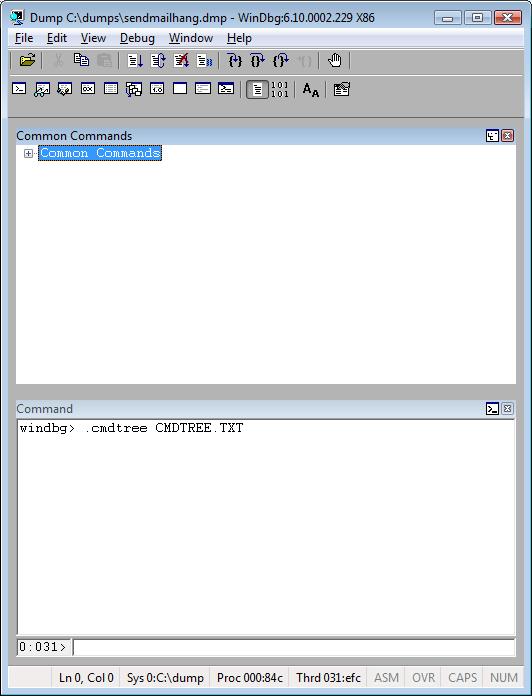
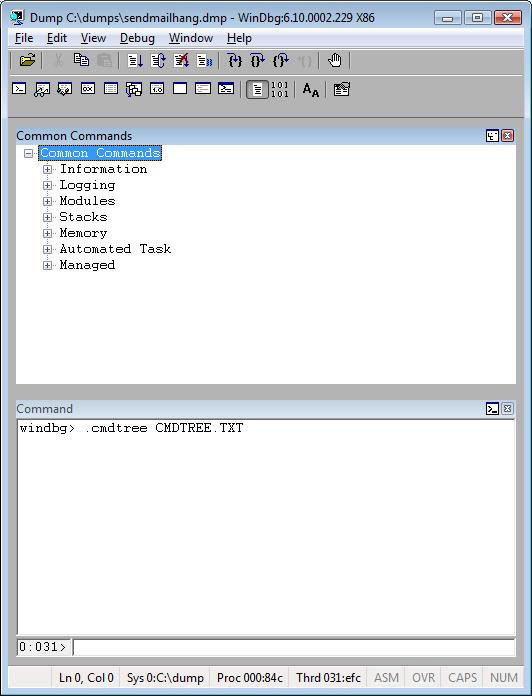
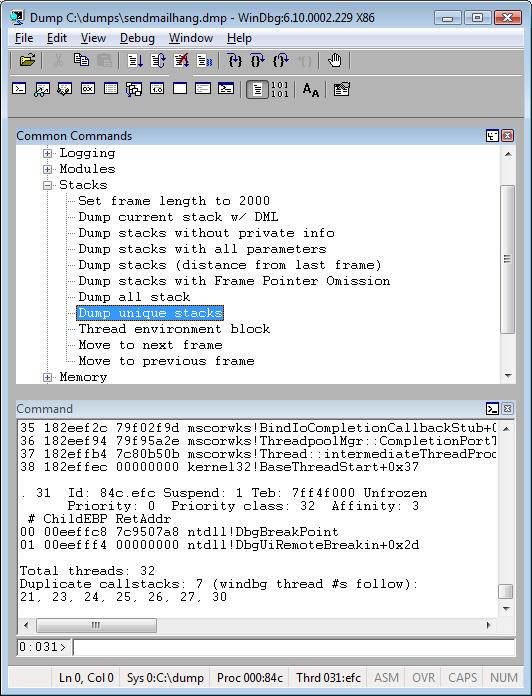
d) The command above will create a new WinDbg window that has your commands. You can double click one item from the tree view window to execute the command.
See you on my next article.