Using MFTrace to Trace Media Foundation
We are continuing our series on Media Foundation and its tracing by introducing a new tool available in the latest Windows SDK: MFTrace. This tool is similar to Event Viewer: Both tools collect traces which give some insight into what Media Foundation and its components are doing. However, MFTrace is much more powerful, and collects way more information, than Event viewer.
After installing the SDK, MFTrace is available in two flavors:
- 32b in %PROGRAMFILES%\Microsoft SDKs\Windows\v7.1\Bin
- 64b in %PROGRAMFILES%\Microsoft SDKs\Windows\v7.1\Bin\x64
The tool itself is made of three binaries (MFTrace.exe, MFDetours.dll, detoured.dll) and an optional configuration file (mftrace.xml). From the name of the binaries, it should not come as a surprise that the tool relies heavily on the Detours library to inject itself into the target process and intercept function calls.
The traces usually follow the pattern of a process and thread ID, followed by a timestamp, the name of the function called, and some function parameters:
In some cases, MFTrace goes one step further and does some deep inspection of the function parameters to gather more details—for instance, displaying entire topologies.
Collecting your first trace
As a first practice, let’s use our favorite guinea pig: Notepad. MFTrace can indeed target any application, not just those based on Media Foundation. As a matter of fact, MFTrace also intercepts some functions from COM, DirectShow, and DirectX.
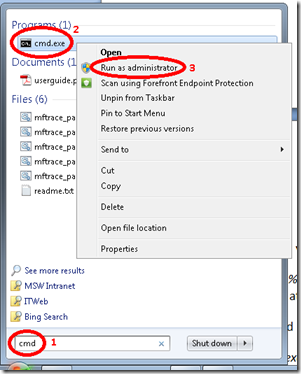
First, open an elevated command prompt:
Then add the SDK to your path, if you haven’t already done so:
set PATH=%PATH%;“%PROGRAMFILES%\Microsoft SDKs\Windows\v7.1\Bin”
(add ‘x64’ at the end if using the 64b version of MFTrace)
Now run Notepad under MFTrace:
MFTrace.exe notepad.exe
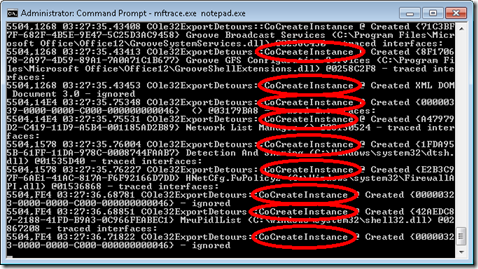
MFTrace will start printing a few traces at the command prompt. To make things a little more interesting, try opening some file in Notepad. Right away you will see a large number of calls to CoCreateInstance:
To end tracing, just close Notepad or hit CTRL+C.
Note: 32-bit processes on 64-bit Windows
If you are using a 32-bit version of Windows, you can skip this warning. Otherwise, please read on. MFTrace comes in two flavors: 32-bit and 64-bit. Each version can only trace processes of the same kind, so if you want to trace a 32-bit process you need to use 32-bit MFTrace; and if you want to trace a 64-bit process, you need to use 64-bit MFTrace. Where it gets tricky is that some processes (such as Windows Media Player) run by default as 32-bit processes on 64-bit Windows.
One way to tell whether a process is 32- or 64-bit is to look at its path:
- 32-bit processes can be found under %PROGRAMFILES(X86)%
- 64-bit processes can be found under %PROGRAMFILES%
Usually these environment variable resolve to “c:\program files (x86)” for 32-bit, and “c:\program files” for 64-bit.
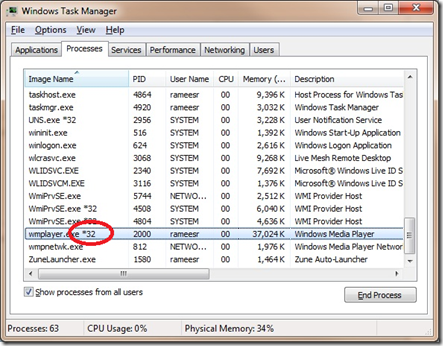
Another way is to open the Task Manager (CTRL+SHIFT+ESC) and look for ‘*32’ at the end of process names.
Collecting your first useful trace
Printing traces at the command prompt is nice, but too slow to handle the amount of traces that are generated by media applications. Instead, traces can be redirected to a file using the ‘-o’ command-line parameter.
Besides starting a new process, MFTrace can also attach to an existing process via the ‘-a’ command-line parameter. This parameter accepts either a process name or a process ID. One word of caution: MFTrace is only able to intercept function calls on objects which have been created after MFTrace attached itself. So if you start playing a video in Windows Media Player and then attach MFTrace to it, MFTrace will miss most of the action.
Armed with that knowledge, we can now start tracing something a bit more interesting: Windows Media Player. Open Windows Media Player and attach MFTrace with this command line:
mftrace.exe -a wmplayer.exe -o mf.log
Then open a media file in Windows Media Player (for example, "%PUBLIC%\Videos\Sample Videos\Wildlife.wmv"), let it play for a few seconds, exit MFTrace (CTRL+C), and open mf.log in your favorite text editor. You will have a detailed record of what Media Foundation and its components have been doing in the background to play the file.
Logs tend to contain a huge amount of data, which can be quite overwhelming at first. In the next installments of this blog series, we will try to make sense of them. We will also see how to add traces from your own components and applications, to get a fuller picture of what is going on.
In the meantime, for more help see ‘mftrace.exe -?’, the MSDN page dedicated to MFTrace, or post questions on the Media Foundation forum.


