Experienced Challenge 4: Hmmm, So Maybe This IS Rocket Science After All
Office Programs Required |
Microsoft Excel 2007 |
Goldfish Awarded |
5 |
Deadline for Submission |
Friday, April 24, 2009 (8:00 AM Pacific Daylight Time) |
Files Required |
Experienced_challenge_4.xlsm in the OfficePalooza Challenge Pack. |
What goes up must come down, right? (Trust us, it does ... as those of us who own shares of Microsoft stock can attest.) The real question, of course, is how high does it go before it comes down? Well, that and when does it come down, and where?
In other words, there are all sorts of questions you have to answer in order to solve Challenge 4.
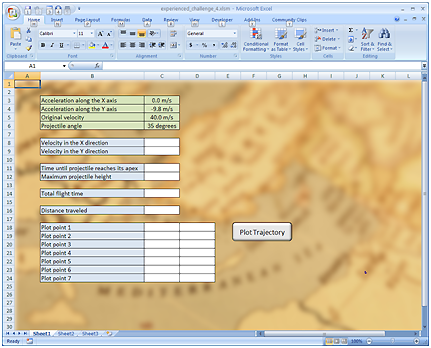
And just how are you supposed to go about answering them? Well, for starters, you need to grab a copy of the file Experienced_challenge_4.xlsm, a file found in the OfficePalooza Challenge Pack . That file looks like this:

What you need to do (among other things) is right-click the Plot Trajectory button, click AssignMacro, and then edit the PlotTrajectory subroutine. That’s a Visual Basic for Applications (VBA) subroutine that looks like this:
Sub PlotTrajectory()
End Sub
But it won’t look like this for long. You’ll soon be adding code that takes the information found in the green boxes (acceleration along the x and y axis; original velocity; and projectile angle) and plots the trajectory of a rocket. To be more specific, your code needs to perform the following calculations, using the following algorithms:
· Calculate velocity in the X direction: Original velocity * Cosine(Projectile angle).
· Calculate velocity in the Y direction: Original velocity * Sine(Projectile angle).
· Calculate the time until the projectile reaches its apex (that is, its highest point) : (X acceleration - Y velocity) / (Y acceleration).
· Calculate the maximum projectile height: (Y velocity * Apex time) + (0.5 * Y acceleration * (Apex time squared)).
· Calculate the total flight time: (Apex time) * 2.
· Calculate the total distance traveled: (X velocity) *( total flight time).
Note. Complicated? Believe it or not, no; after all, we did leave out such things as wind resistance and the rotation of the earth. That seemed a little too much to ask just for an OfficePalooza challenge.
And just what do you do with all this information? Well, for starters, you need to paste the derived values in the appropriate white-colored boxes in the spreadsheet (for example, the total flight time for the rocket goes in the box labeled Total flight time). Next, you need to determine X and Y values for this trajectory in at least three different places: the beginning of the flight; the middle of the flight; and the end of the flight. (We’ll give you a hint: the rocket will have an altitude of 0 at both the start of the flight and at the end of the flight.) These values need to be placed in the boxes labeled Plot point 1; Plot point 4; and Plot point 7. You also need to place intermediate values in the boxes labeled Plot point 2; Plot point 3; Plot point 5; and Plot point 6. We aren’t going to be picky here; you can just estimate what the distance traveled and height would be at these points.
The net result should look something like this:
Plot point 1 |
1 |
0 |
Plot point 2 |
20 |
5 |
Plot point 3 |
35 |
8 |
Plot point 4 |
50 |
12 |
Plot point 5 |
70 |
8 |
Plot point 6 |
85 |
5 |
Plot point 7 |
100 |
0 |
Note. Although it should look something like this it shouldn’t look exactly like this. That’s because these aren’t the correct values.
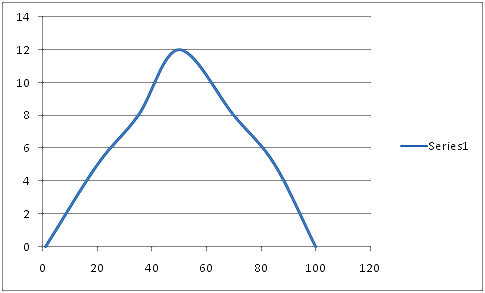
And then you’re done, right? Right … except for the fact that your subroutine must then create a scatter chart using those plot points. That scatter chart will show the approximate trajectory of the rocket, and will look something like this:

And then you’re done. We promise.
Submitting Your Entry
The OfficePalooza sweepstakes is over, but you’re welcome to try the challenges and learn on your own. Good luck!