MSBuild is a fundamental part of the .NET development experience, but it can be challenging to new and experienced developers alike. To help developers better understand their project files and access advanced functionality that requires editing the project file directly, we’re releasing an experimental MSBuild editor that has a much richer understanding of MSBuild files than the current XML schema allows. Based on feedback, we hope to make it available by default to all .NET developers. If you work with MSBuild files at all, please try it and let us know how it goes.
Who is this for?
Although Visual Studio provides a rich UI for managing your project and its settings, you may need to edit your csproj file directly to access certain advanced features that are not exposed in the UI. You may also need to edit csproj files directly when merging changes from source control, or you may be writing targets and props files for local use or for publishing in a NuGet package. If any of these scenarios apply to you, we’d like your feedback on the new experience.
Understand your project file
The new MSBuild editor provides Quick Info not just for XML elements in MSBuild files, but also for properties, items and metadata in MSBuild expressions. The Quick Info popup is richer, and has deep links to relevant documentation, as well as hyperlinks to references in other files that may help you understand how that property or item is used by the underlying targets.
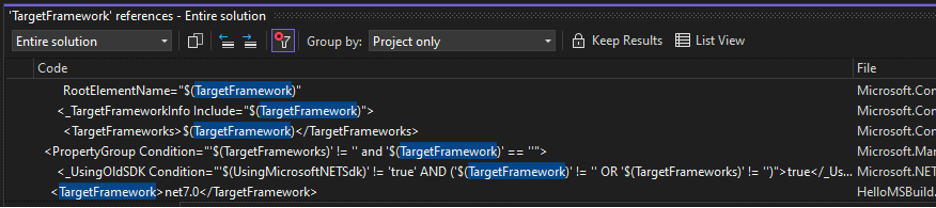
If you’d like to understand how a property or item is used, you can use Ctrl-Click or the Go to Definition command to go to where it’s defined. You can also use the Find References command to perform a precise search across all imported files:
Code without leaving the editor
Even as an experienced MSBuild author, I often used to open the documentation to find the exact names and allowed values of MSBuild properties, items and metadata. I do that far less when using the MSBuild editor, as it provides IntelliSense almost everywhere in the file, with documentation powered by its schemas:
It has special support for NuGet packages, allowing you to search for the package ID, and see the package description and a link to its NuGet.org page:
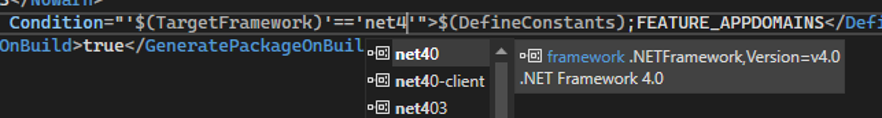
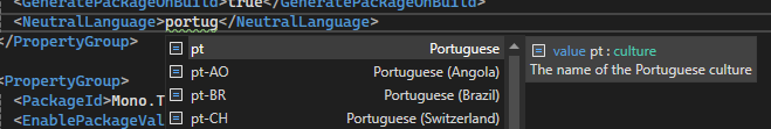
Other types also have special handling, for example culture names:
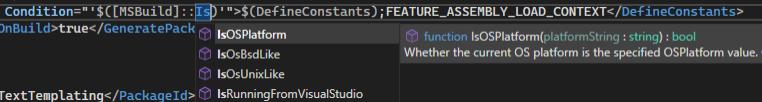
And there is IntelliSense within MSBuild expressions, including property functions and item functions:
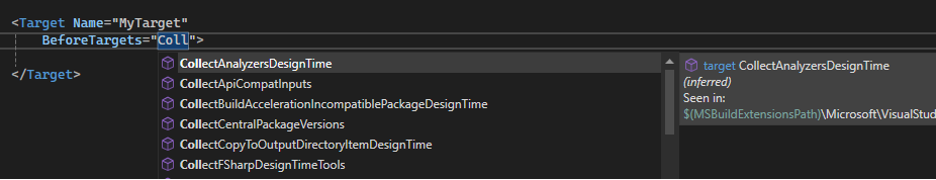
The editor isn’t limited to those properties and items defined in its schemas. It scans all imported MSBuild files, and provides inferred completion for any properties, items, metadata and targets it finds in those files as well. Even better, the tooltip has a hyperlink to the property or item is used in:
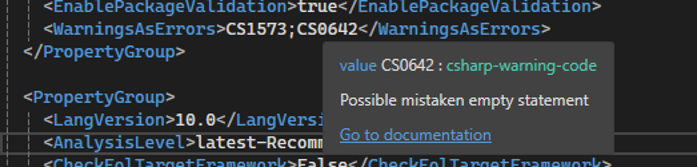
Catch problems early
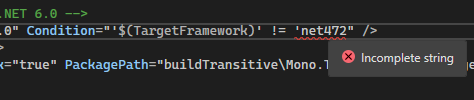
The MSBuild Editor’s validations go beyond just XML validation. It overlays a type system onto MSBuild, so you will get errors about malformed values such as URLs or version strings. Its understanding of the MSBuild expression format means you can catch malformed conditions and expressions without having to run your build.
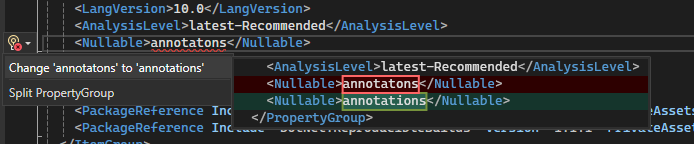
There are even a few Roslyn-style analyzers and code fixes.
Enhance the MSBuild editing experience
The MSBuild Editor is powered by a new MSBuild-specific json-based schema format that allows defining documentation and type annotations for MSBuild properties, items, item metadata, and targets. It includes built-in schemas for the .NET SDK and other commonly used targets and SDKs.
However, you can also write schemas for your own MSBuild targets to allow the MSBuild editor to provide a richer experience when editing or consuming them. If you’re an author of a NuGet package that contains build targets, you can ship that sidecar schema in the NuGet package to provide a better MSBuild editing experience for consumers of your package.
Q&A
Q. The extension has a GitHub repository – can I build from source and contribute?
A. Absolutely! Just clone the repository and its submodules, open in Visual Studio, and hit F5.
Q. Why do the extension repository, namespaces and assemblies have “MonoDevelop” in the name?
A. MSBuild Editor is a descendant of an extension I originally created for the MonoDevelop IDE in March 2015. Although it evolved a lot over the years, including porting to Visual Studio, I kept the internal name for nostalgia’s sake.
Q. Can I use the extension in Visual Studio Code?
A. Not yet! I’m currently porting the extension to LSP (Language Server Protocol) so it can be used in a Visual Studio Code extension. While LSP would be the obvious choice for a new extension, this codebase goes back to before Visual Studio Code was released.
We want your feedback!
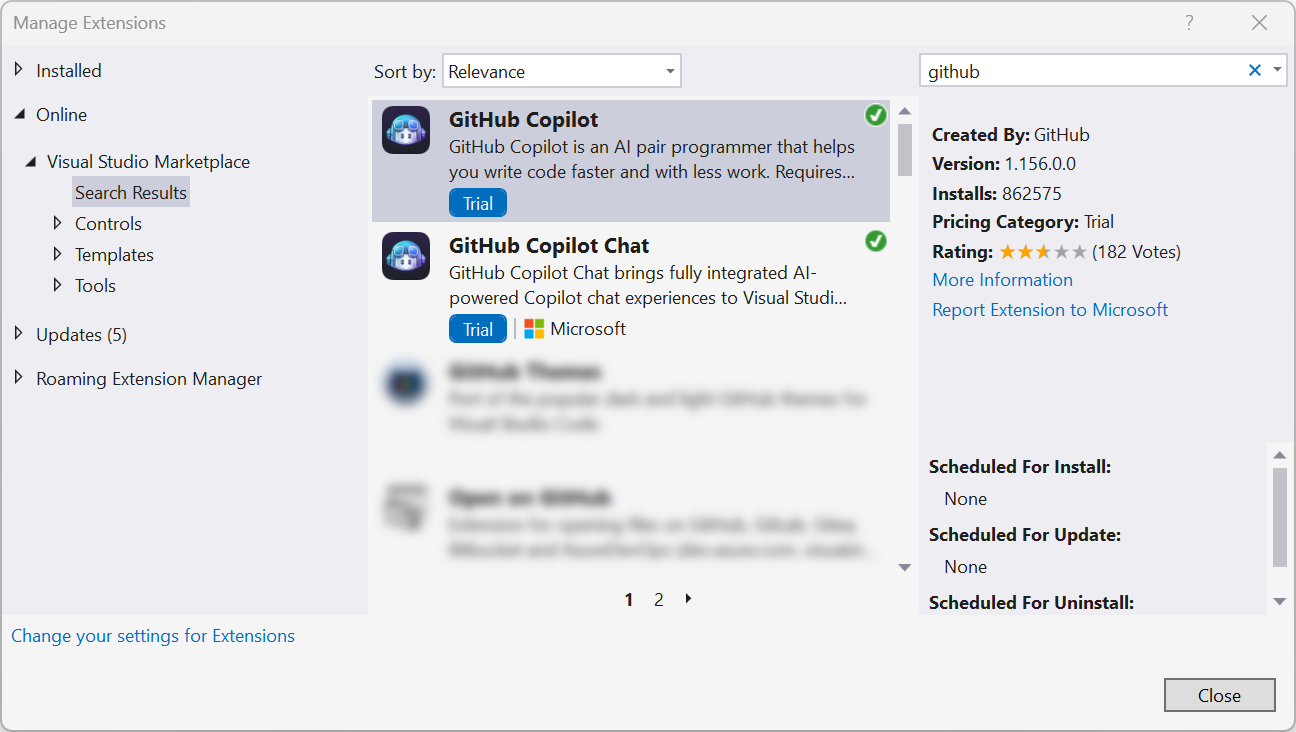
If you’d like to give the extension a spin, you can find it by searching for “MSBuild Editor” from within Visual Studio extension manager or download it from the Visual Studio Marketplace. The extension is currently only available for Visual Studio, but work is in progress on porting it to Visual Studio Code.
If you run into any problems with the extension, please post them on its GitHub issues page. The extension is open source and contributions are welcome. Please also let us know about your experience by filling out this survey. We appreciate your feedback, and it will help guide how the experiment develops and whether the MSBuild Editor becomes an officially supported part of the .NET development experience.
The post A new MSBuild editing experience appeared first on Visual Studio Blog.
]]>


 Tip: press