Introducing Windows Azure Diagnostics
You may have seen the announcement of the latest release (November 2009) of the Windows Azure Tools and SDK. We are PDC 2009 in Los Angeles introducing a bunch of these new platform features and discussing these with the folks who are really going to make these shine, you, the developers!
Today I wanted to talk about the new Windows Azure Diagnostic feature that we have introduced with the SDK.
Starting with PDC08 we provided a basic logging system which consisted of the following:
- RoleManager.WriteToLog() API that let you perform simple logging in your service, and
- ‘Copy Logs’ button the Windows Azure Developer Portal that enabled you to transfer all those logs from the instances of your service into your Windows Azure storage account.
Why something new?
There are a number of diagnostic scenarios that go beyond simple logging. Over the past year we received a lot of feedback from customers regarding this as well. We designed Windows Azure Diagnostics to address some of those scenarios, e.g.
- Detecting and troubleshooting problems
- Performance measurement
- Analytics and QoS
- Capacity planning
- And more…
Based on the feedback we received we wanted to keep the simplicity of the initial logging API but enhance the feature to give users more diagnostic data about their service and to give users more control of their diagnostic data. The November 2009 marks our initial release of the Diagnostics feature .
What’s new?
Let me first talk a little about what is available as part of this new feature.
- Perform simple logging using the standard System.Diagnostics.Trace APIs
- Collect the following types of diagnostics data
- IIS Logs
- Failed Request Logs
- Performance Counters
- Windows Event Logs
- Application crash dumps
- APIs to configure the collection of data
- Transfer the collected data from your service to your storage account on an On Demand or a scheduled basis.
What is the architecture?
The Diagnostic feature is architected to be decoupled from the Windows Azure platform to enable users to have control over the diagnostic data that they need for their service, without the platform adding any more layers in between.
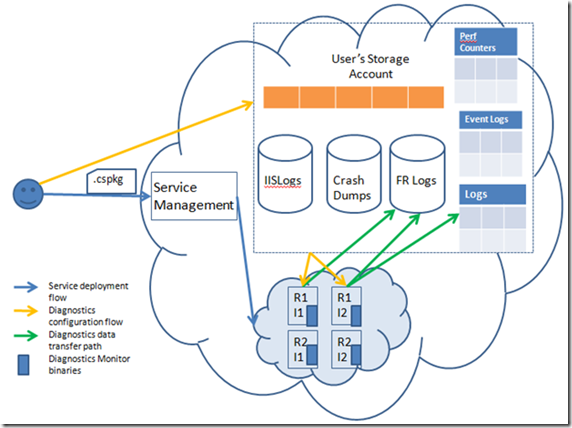
The following schematic gives a general idea of how the Diagnostic feature is architected.
The gist of the diagram above is: Diagnostics Monitor (the small blue boxes in the role instances above) running as part of each instance of each role of the service collects diagnostics data as configured by the user and persists it in the user’s Windows Azure Storage account, as configured by the user, on an on-demand basis or at a regular scheduled interval.
Full Trust
The implementation of Windows Azure Diagnostics feature requires the roles to be run in full trust. In other words enableNativeCodeExecution attribute needs to be true for your roles in ServiceDefinition.csdef. With the November 2009 release of Windows Azure Tools and SDK, default value for this attribute is true .
Diagnostic Configuration
Configuration tells the diagnostics infrastructure which particular data types is the user interested in collecting. Once a data type is enabled, the infrastructure starts collecting the data locally on the VM of any given instance. On the desktop it is collected on the local disk.
This configuration can be defined in 2 ways:
- Role Startup: The user can define what she needs to collect for a particular role at role start up time.
- After startup: The user can modify the configuration of the running service by using Diagnostic Management API from outside the cloud (e.g. through a client side tool on the user’s desktop). This can be done without bringing the service down.
How do I use this?
Now that we have gone over the feature broadly, it’s time to write some code. I will go over the APIs and tools available for developers to leverage this feature in their code in the next post. For now, I need to do my rounds at PDC :).
