
C++ IDE Performance Improvement in Visual Studio 2013 Preview
My name is Li Shao. I am a Senior Software Design Engineer in Test on the VC++ team. In this blog, I would like to share the performance enhancements we’ve made in VS 2013 Preview to improve the C++ IDE and build system.
Performance is a vital part of software quality. Over the last couple of releases we have made significant performance improvements in areas such as solution load, IntelliSense and code navigation. In VS 2013, we focused our performance effort on a few other key scenarios such as configuration switching, responsiveness and build throughput. We also improved the way we monitor real-world performance, something we refer to as Performance Telemetry.
Faster Configuration Switching
Based on feedback from C++ developers, we focused our performance tuning effort on configuration switching. We used a real-world application with 800 projects as a benchmark solution for driving performance gains. One of the major contributors to configuration switching time we discovered had to do with the complexity of the file structure in the solution navigator. We had some inefficient ways of re-computing file expansions state and filters – by focusing on this code plus a few additional bugs along the way, we drove some very significant performance improvements to configuration switching times. Below is the data before and after the performance improvement for this real-world application:
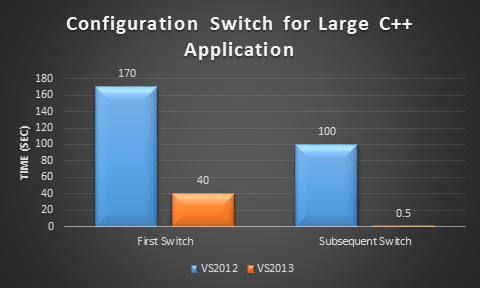
Figure 1: Performance improvement in C++ configuration switch operation
For this solution:
- First time switch configuration time improved by roughly 75% compared to VS 2012
- Subsequent switch configuration time improved from one and half minutes to less than half second
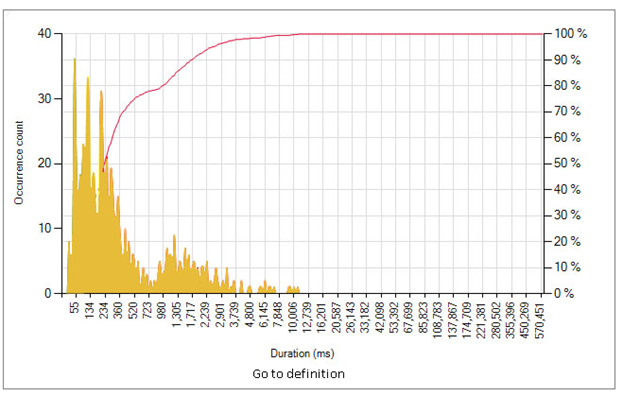
In addition to performance tuning, we have also added telemetry so that we can find additional opportunities to improve performance across all solutions. Below is a snap shot of the telemetry data for switching configuration:
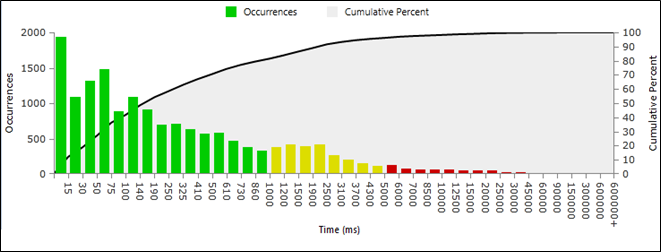
Figure 2: Telemetry data on configuration switching
X-axis is the time to perform configuration switch operation in milliseconds. Y-axis on the left is the number occurrence in each bucket. Y-axis on the right is the cumulative percentage in each bucket.
From the telemetry data, we can see that the median elapsed time for configuration switching is now less than 100ms. There are less than 10% of the instances taking more than 6s. If you still feel that Visual Studio 2013 configuration switching performance is not up to your expectation, please help us by providing a repro and profile using Visual Studio 2013 Preview Feedback Tools.
Better responsiveness
One major infrastructure investment we have made to improve performance is to move the C++ project system into a multi-threaded model. This provides agility for most code in the project system to run on any thread, allowing for concurrent execution and better responsiveness. This work also reduced the sources of hangs. For example, in VS 2012, an individual project was loaded in about 3 chunks, and each happened on the UI which included I/O. In VS 2013, with the multi-threading work, we are able to do much of the work (including I/O) off the main thread completely. The parts that remain on the UI thread are executed in smaller chunks so responsiveness is a lot more guaranteed than before. My colleague Andrew Arnott will discuss this work in more detail in future blog post.
For the editing experience, we now have telemetry infrastructure in place to help us monitor real-world typing responsiveness. Figure 3 shows the Telemetry data for typing responsiveness in VS 2013. You may remember Eric Knox’s blog post on VS 2012 typing responsiveness. Compared to VS 2012, VS 2013 is on par with VS 2012 with 98.8% of C++ keystrokes processed in under 50ms (Figure 3.A). In the >50ms range, we are also seeing more data points shifting from the 100-250ms (VS 2012 0.48%, VS 2013 0.30%) bucket to 50-100ms (VS 2012 0.37%, VS 2013 0.57%) bucket, compared to VS 2012 (Figure 3.B). The VS 2013 Preview C++ typing median responsiveness is 15ms (Figure 3.C).
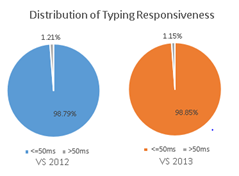

(A) (B)
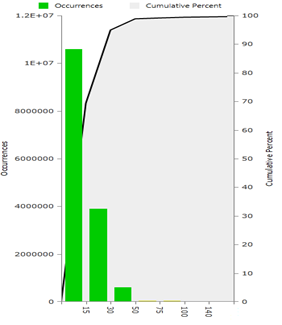
(C)
Figure 3: VS 2013 C++ editor typing responsiveness telemetry data
In addition to typing responsiveness, we’ve also fixed a variety of performance bugs, including an issue that could result in an O(n2) algorithm when saving files that are checked into source code control. This can greatly improve the experience when dealing with large applications.
Faster build throughput
For the VS 2013 Preview release, we have made various fixes to improve compiler throughput. Based on our internal measurement, we have improved the compiler throughput in scenarios where you are not using the multi-processor compilation flag (the non /MP case) by 10% (Figure 4.A).
For those of you who are using the MP compilation switch, we have also reduced the compiler overhead and improved the overall build throughput on machines with many cores. Figure 4.B shows the throughout improvement when building a large internal application on a 48-core machine. In this example, the overall build time was almost cut in half in VS 2013, compared to VS 2012.
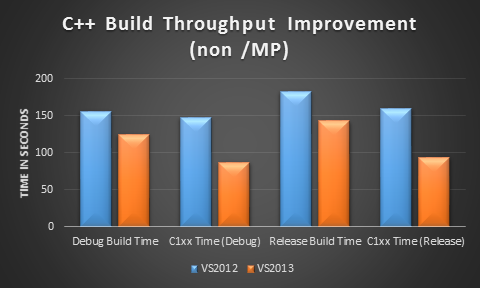
(A)

(B)
Figure 4: C++ build throughput improvement
Faster incremental build for Windows Store apps with WinMD references
In VS 2012, for a Windows Store app which has references to one or more WinMD projects (a project that generates WinMDs as output), a change to the source file of the WinMD projects will trigger a full build of the app. In VS 2013, we have made a fix so that the linker timestamp of the WinMD does not change when there is no content change to the WinMD file. This speeds up overall build when making non-content changes to the referenced C++ WinMD. Figure 5 shows an example improvement with one of our internal Windows applications. The same change in the WinMD project would take 15 minutes to build and cost almost the same time as building the entire solution in VS 2012. In VS 2013, it only takes a minute to do the incremental build.
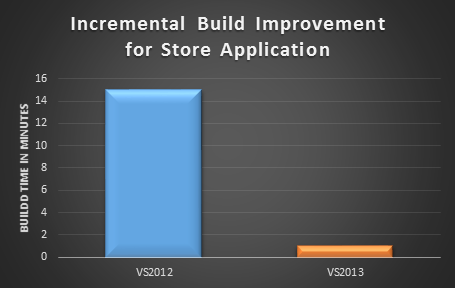
Figure 5: C++ windows store application incremental build throughput improvement
Note that you may not see the full performance improvement if you have managed WinMD projects as part of the reference chain. The reason is that unlike C++ WinMDs, managed WinMDs contain both type signature and implementation, which means any change will cause the WinMD timestamp change. We’d love to hear from you in the comments section below or on our UserVoice site if this scenario is important to you.
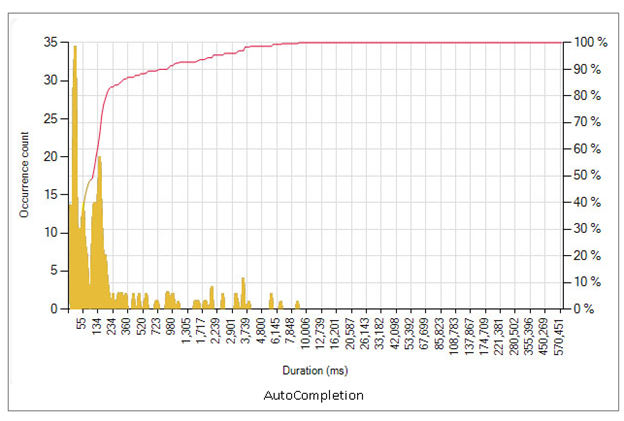
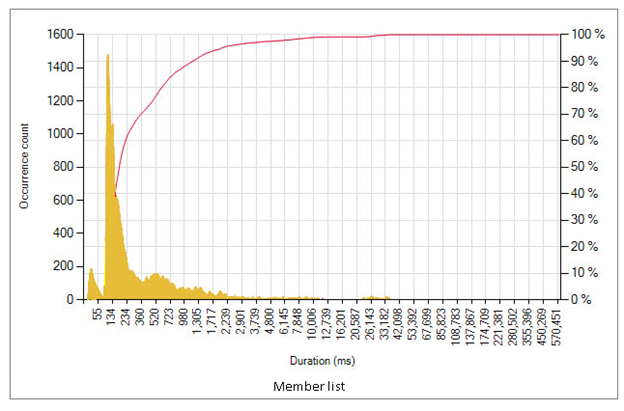
More extensive performance telemetry
As I mentioned earlier, we have made performance improvements in the IntelliSense and code navigation (browsing) features last release. To help us to continue to improve on the performance of these scenarios, we now collect telemetry for Intellisense/browsing operations including Member list population, Auto-completion, Quick info, Parameter help, Go to definition and a few other related operations. Figure 6 has the examples of the trend data that are now available to us. For example, in the trend data below, we can see that the median elapsed time for auto-completion, member list and go to definition are 105ms, 175ms and 226ms respectively. The majority (90%) of the auto-completion and member list operations are now completed within 200ms. We’ll be using this data to prioritize where we invest to improve performance over time; you can help by opt-ing into our Customer Experience Improvement Program (see this blog post for more details)
(A)
(B)
(C)
Figure 6: Telemetry data for Intellisense and code navigation
Above are the important performance improvement and infrastructure work that we have done for VS 2013 Preview to improve the IDE and build throughput experience. We appreciate your continued feedback. If you have not already done so, please download the VS2013 Preview release, and provide us with feedback in the comments section below, through UserVoice, using the VS 2013 preview feedback tool to help us prioritize the work we do to improve the experience when working with Visual Studio.
 Light
Light Dark
Dark
0 comments