When we wrapped up the last release of Visual Studio, I wrote a blog post titled: Visual Studio 2013 Diagnostics Investments, which gathered all the links to our blog posts and other content into a single place. It seems fitting to do the same now that VS2015 has RTM’d, and the same intro I wrote last time applies, so I won’t repeat that here.
When I think of the Diagnostics Investments we made in this release, I classify them into 4 broad buckets: platform support, addressing customer feedback, catching performance issues early, and historical debugging with IntelliTrace.
Platform support
Every time Visual Studio needs to support a new operating system version or platform, the Visual Studio Diagnostics team has to do a bunch of work just to keep things working before even considering adding new capabilities – and we added a bunch! This release was no different, adding support for Windows 10 and the various Windows 10 device types, e.g. desktops, tablets, phones, Xbox, and HoloLens. You can now enjoy the regular awesome Visual Studio debugging and profiling experience for all those devices. The same applies to profiling and debugging .NET Native apps and debugging support for ASP.NET 5.
In addition, VS2015 offers C++ mobile cross-platform development support including debugging Android and debugging iOS apps (we also open sourced our code that facilitated the connection between Visual Studio and GDB/LLDB). If C++ is not your cup of tea and you prefer using HTML/JavaScript, we also support debugging Apache Cordova projects against iOS and against Android targets.
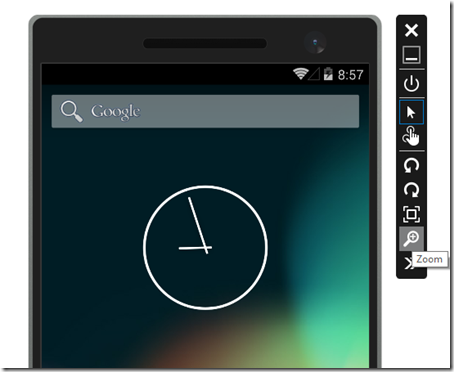
For debugging and deploying to Android, we went a step further and created the best Android emulator on the market [watch video] and made it available for free to any Android developer.
Addressing customer feedback (and modernizing existing features)
The debugger has an extensive set of capabilities meant to provide solutions for the broadest set of customers possible. We frequently talk to customers who need capabilities that already exist in VS, but are not as obvious or discoverable as they could be. Many of these features have been around for over two decades. That means two things. First, there are opportunities for us to modernize older, tired-looking experiences (and prime them for further enhancements/extensibility). Second, when we bring up debugging support for new platforms, there are always capabilities that we run out of time to implement the first time round. With that context, let’s see what we did in this release on those fronts.
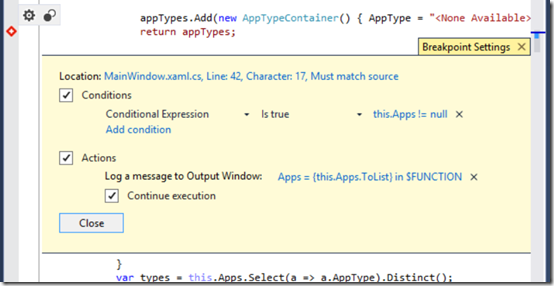
Setting breakpoints is the most basic debugging action that every developer learns on day one. Most developers however haven’t discovered that you can configure breakpoints with conditional statements, hit counts, filters, and even specify logging actions (through Tracepoints). Even if they have discovered them, the usability of those capabilities has been low, making it difficult to use them productively. The same applies to other types of breakpoints such as Function breakpoints, Data breakpoints, and breakpoints on auto-properties. With VS2015, we have completely reimagined the experience of configuring breakpoints, making it more discoverable and more usable. To learn more please read about the New Breakpoint Configuration Experience, or watch this demo about using the new Breakpoint Settings.
Beyond breakpoints, the other way your app halts execution and “breaks” under the debugger is when an unhandled exception gets thrown. You have been able to configure breaking when specific exceptions are first thrown (not just unhandled), but again many folks don’t know about that, and the usability of the experience left a lot to be desired. With VS2015, we have updated the experience of configuring exceptions by making it more discoverable and more usable. To learn more about that please read about the New Exception Settings Window, or watch this demo about the revamped experience.
The reason you use/configure breakpoints or exceptions to break execution is, of course, to inspect state such as variable values via one of the many windows, e.g. Locals, Autos, Watch, Immediate, and DataTips to name just a few. Inspecting state includes sometimes executing code, i.e. making function calls. Ever since lambdas were introduced in .NET languages it has been a significant pain-point that you could not use lambdas in your expression evaluations. With VS2015, we are offering exactly that capability. To learn more about that, please read our blog post detailing lambda debugging support.
A huge time-saving debugger feature is what we call EnC, the ability to edit code and then continue debugging (typically combined with Set Next Statement) without restarting the debugging session. Unfortunately, as the C# compiler/language evolved, EnC didn’t get the parallel love you would hope. This left EnC not working at all in various common scenarios such as inside async functions, inside lambda expressions, and under remote debugging, to name a few. With VS2015 we have removed many restrictions, making EnC applicable again in most of your debugging sessions. To learn more about that please read our blog posts about .NET edit and continue improvements: part 1, and part 2.
Speaking of EnC, for C++ projects we have also started improvements for this capability including x64 bit. Learn more about it in this blog post: C++ EnC in Visual Studio 2015. For you C++ developers, VS2015 offers you faster startup debugging and improved resiliency during function evaluation.
Last, but certainly not least, a common request from developers building XAML applications has been to interactively inspect the UI layer, and VS2015 offers exactly that with UI Debugging Tools for XAML.
Catching performance issues early
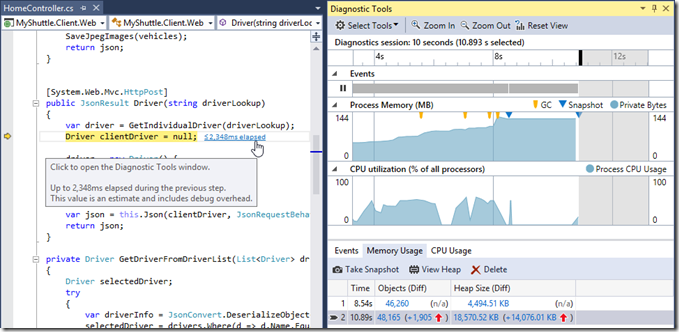
When we speak to developers at conferences, in our usability labs, and anywhere else we can find them, a common theme emerges that is validated by our own product telemetry: very few people use profiling tools. Even the minority typically use a profiler at the end of the development cycle, too late to identify and fix issues correctly. This is one of the reasons so many apps out there fail to perform up to their potential. In contrast, even if you don’t intend to explicitly debug your app you hit F5 implicitly starting a debugging session, e.g. being susceptible to asserts, exceptions, observing the Output window etc that helps you to identify correctness issues. With VS2015, we aspire to bring to you the identification of performance issues in a similar way, through a feature we call PerfTips and through the brand new Diagnostic Tools window (with the Break events, CPU Usage, and Memory Usage tools).
We have a lot of content for you to read up on this, and this is the recommended order:
- PerfTips: Performance Information at-a-glance while Debugging
- Diagnostic Tools debugger window
- Memory Usage Tool while debugging
- Walkthrough: Analyze Performance While Debugging
- Diagnosing Event Handler Leaks with the Memory Usage Tool
- //BUILD/ Video: Debugging Performance Issues Using Visual Studio 2015
- Channel9 Video: Visual Studio 2015 Diagnostic Tools [skip to 14minutes]
- Connect Video: PerfTips and the Diagnostic Tools Window
For those of you using the profiling tools without the debugger, you will find a New UI Performance Analysis Tool for WPF Applications, a new Network tool, and some menu movement that is summarized in this post: Performance and Diagnostic Tools in VS2015.
Historical debugging with IntelliTrace
IntelliTrace is a feature that first shipped with Visual Studio 2010 Ultimate as an indispensable debugging tool aimed at eliminating the “no repro” scenario. With VS2012, VS2013 and all the Updates for those releases we focused on making IntelliTrace better for diagnosing issues in production. With VS2015, we doubled down on making IntelliTrace awesome for your everyday Visual Studio debugging.
Visual Studio 2015 has a new SKU lineup. The Premium and Ultimate editions were essentially merged into the new Enterprise edition at a fraction of the Ultimate cost! This is great news for developers who wanted to use IntelliTrace but didn’t have access to Ultimate in previous releases.
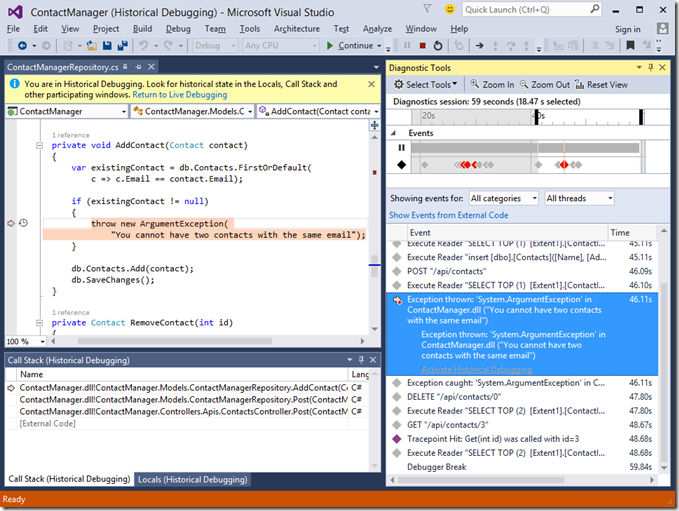
Beyond making it more accessible financially, with VS2015 you get a completely revamped IntelliTrace UI and experience. It now supports Just My Code (JMC), displays the data collected live without having to break under the debugger and it also supports attaching to a running process. Also when you enter Historical Debugging you get a much more streamlined and polished experience. But perhaps the most notable improvement is that IntelliTrace is now part of the new Diagnostic Tools window, offering a new graphical timeline for the events collected to complement the tabular view. The new IntelliTrace timeline helps visualize your application’s execution over time, but also allows you to select and focus on ranges of time, thus filtering the events to your selection.
We have a lot of content for you to read up on how IntelliTrace can help you, and this is the recommended order:
- IntelliTrace in Visual Studio Enterprise 2015 – A good overview post
- Walkthrough using IntelliTrace – Demo #1 [or watch the video – for the demo start at 4m5s]
- Walkthrough using IntelliTrace – Demo #2 [or watch the video]
- Finding swallowed and async exceptions using IntelliTrace in VS2015 [or watch the video – for the demo start at 43m5s]
- 75min recording of the IntelliTrace session delivered at Ignite 2015 by the product team (covers the demos listed above)
- Announcement of IntelliTrace supporting attaching to a running process
- Announcement of the return of the IntelliTrace standalone collector, which lets you collect data from a production or production-like environment
- How to collect data from a windows service using the IntelliTrace Standalone Collector
- Summary of all IntelliTrace learning resources (including older versions of Visual Studio)
Summary
The edit-build-diagnose inner development loop is where you spend most of your time. In this post I shared a bunch of links to blog posts and videos explaining how Visual Studio 2015 makes you more productive during the diagnose step in the cycle; for your new or existing code. If you have feedback for any of these I strongly encourage you to leave a comment on one of the links I shared above where their respective authors can respond to you, or you can engage in our MSDN diagnostics forum, and we are always monitoring uservoice.


0 comments